
Analysing the financial strength of bond issuers
Last month, I published an article explaining the obligation for most bond issuers to publish an updated Financial Analysis Summary (FAS) on an annual basis. Since most companies whose bonds are listed on the regulated Main Market of the Malta Stock Exchange have a December year-end, the annual financial statements of the issuing company or the guarantor must be issued by the end of April and in line with the listing policies of March 2013, an updated FAS must be published within two months of the issuance of the annual financial statements.
As such, in recent weeks most bond issuers published their 2017 annual financial statements and their projections for the current financial year via an updated FAS. The lengthy reports contain important information for analysts and investors and in today’s article, the aim is to start providing some highlights of the main findings through one of the most commonly used financial indicators across the industry.
The financial strength of a bond issuer can be measured in various ways. Across international markets, most investors rely on ratings by the credit rating agencies who publish their findings based on specific criteria. However, in Malta, although bond issuers are unrated, this does not necessarily make them high risk or at par to the many sub-investment grade bonds which unfortunately many local investors are exposed to, some of which may also have defaulted over the years.
Financial intermediaries should aim to guide retail investors accordingly on the financial strength of bond issuers. The financial robustness can be measured in various ways. Two common ratios used to measure the strength of a bond issuer are the interest coverage ratio as well as the gearing ratio.
Following the publication of the annual financial statements as well as the projections, it is possible to rank the various issuers according to the strength displayed by these two important solvency ratios.
In this week’s article, I am displaying a table showing those bond issuers having the best interest coverage ratio as well as those showing the weakest ratio (based on the 2018 forecasts). Next week’s article will then be dedicated to the net debt to EBITDA multiple which is one of the measures for calculating the gearing ratio.
The top 5 issuers all have interest coverage ratios of above 10 times which is a truly comforting signal for investors as well as for the overall market since it shows that there are several companies who display a strong level of financial strength.
The top position goes to Simonds Farsons Cisk plc with an interest coverage ratio of 17.9 times for the 2017/18 financial year which is projected to improve to 18.5 times during the current financial year to 31 January 2019. The recent financial performance of Farsons has been truly remarkable as its profits more than doubled in recent years.
Many investors may be surprised that Premier Capital plc ranks in second place. However, the acquisition of McDonald’s Romania late in January 2016 led to a complete transformation of the financial performance of Premier Capital. In fact, from a company which generated an average annual earnings before interest, tax, depreciation and amortization (“EBITDA”) of €10 million in 2014 and 2015, EBITDA increased more than threefold to reach €32.7 million during 2016 and grew by a further 7.1% in 2017 to €35.1 million. The updated FAS indicates that Premier Capital is projecting a 9.7% increase in EBITDA to €38.5 million which will help the interest coverage ratio continue to improve to 12.2 times in 2018.
Third-placed Virtu Finance plc tapped the local bond market for the first time in October 2017 with a €25 million bond issue to partly finance the €75 million acquisition of a new high-speed vessel. The financial performance of the guarantor (Virtu Maritime Limited) has remained strong and consistent in recent years achieving an average normalised EBITDA margin of nearly 40% annually. The Virtu Maritime group generated a normalised EBITDA figure of €13.9 million in 2017, representing a 3.2% increase over the previous year and the company expects a marginal improvement during 2018. The interest coverage ratio improved to 11 times in 2017 from 9.2 times in 2016 reflecting the increase in EBITDA as well as the decrease in net finance costs (as the group repaid some of its borrowings). During 2018, total borrowings are expected to increase by a further €30 million (to reach almost €98 million) reflecting the financing required for the final tranche due with respect to the construction of the new vessel. Since net finance costs for 2018 underestimates the actual finance costs given that some of these are capitalised until the new vessel is delivered and starts to operate, the interest cover for 2018 is still anticipated to improve further to just above 12 times. As from 2019, one would naturally expect an increase in finance costs which could potentially lead to a lower interest coverage depending on the EBITDA contribution from the new vessel which is expected to commence operations during the first quarter of 2019. It would therefore be interesting to read next year’s updated FAS of Virtu Finance as this would show, for the first time, the financial impact of the sizeable investment being undertaken.
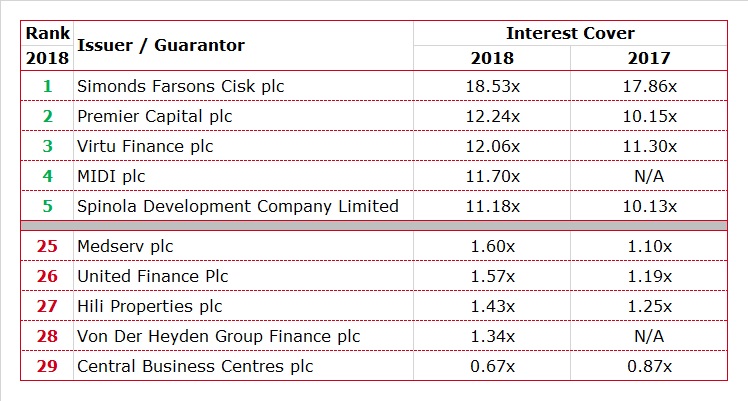
The fourth position of MIDI plc may be somewhat misleading and also reflects the difficulty in analyzing the financial strength of a property development company since the financial performance in any single year is very much dependent on the timing of final deeds of property sales. In fact, while MIDI had a negative EBITDA in 2017 due to the lack of sales from property development, its EBITDA is expected to amount to just over €25 million in 2018 as it anticipates entering into the final deeds for most of the apartments forming part of the Q2 development in Tigne Point. This will lead to an interest coverage ratio of 11.7 times in 2018. However, in view of the finite nature of property development activities, this ratio will inevitably decline again in 2019 as a significantly lower number of apartments are expected to be delivered next year.
The bonds of Tumas Investments plc are guaranteed by Spinola Development Company Ltd whose financial performance has also improved strongly in recent years reflecting the strong growth in tourism. The EBITDA in 2017 improved not only as a result of another record year in tourism but also due to the fact that the hotel was closed for 10 weeks in 2016 for the major refurbishment exercise and also a higher contribution from property development activities. The interest cover is expected to strengthen to 11.2 times in 2018 from 10.1 times in 2017 as a result of another strong year for the hotel as well as a significant increase in property development due to the delivery of several units within the Laguna project.
While it is important to highlight the companies displaying evident signs of strength in their financial performance, it is also equally important to focus on companies which have weaker credit metrics.
Incidentally, among the 29 bond issuers (excluding the banks and insurance providers) on the regulated Main Market of the MSE, the weakest 5 companies in terms of the interest cover all have a ratio below 2 times.
Medserv plc registered a weak financial performance in 2016 and 2017 as a result of the delay in a number of projects following the downturn in the oil and gas industry. This led to the interest cover dropping to only 1.1 times in 2017. However, this is anticipated to improve to 1.6 times during the current financial year.
Hili Properties has a portfolio of 24 properties valued at €104 million as at 31 December 2017 (excluding the Benghajsa land). The company generated €6.3 million in rental income in 2017, with around 30% receivable from companies within the Hili Ventures Group and other related parties. Hili Properties expects revenue to increase by 10.7% in 2018 reflecting a full twelve-month period from the ART Business Centre 7 (situated in Bucharest, Romania) compared to an eight-month contribution in 2017. This will help the interest coverage ratio improve from 1.26 times to 1.4 times.
Von der Heyden Group Finance plc launched a bond issue in January 2017. This special purpose vehicle is the finance arm of the Von der Heyden Group which in turn has interests in various property projects located in Germany, Poland, Spain and Malta. Furthermore, the Group owns four hotels and manages a further ten hotel properties (some of which are still in development stage). The Von der Heyden Group registered a negative EBITDA in 2017 but this is expected to improve in the years ahead and the group is projecting an EBITDA of €1.4 million in 2018 which would result in an interest cover of 1.3 times. Von der Heyden also has a sizeable amount of assets under development and the sale of part of these assets in future years could boost the financial metrics accordingly.
Central Business Centres had an interest cover of below 1 in 2017 and this is still expected to remain below the critical level of 1 also in 2018. Hopefully, the interest cover will surpass 1 as the St Julian’s development is completed and assuming it will be fully leased out in the near-term.
6pm Holdings plc which reported a negative EBITDA in 2017 and has so far failed to publish an updated FAS providing financial projections for 2018 has been excluded from the rankings.
Financial analysts and investors need to monitor all bond issuers closely to ensure they can honour their financial obligations in future years. The increased obligations for companies on the regulated Main Market via an annually updated FAS is a good initiative since these reports provide added important information to the investing community.
Print This Page DisclaimerThe article contains public information only and is published solely for informational purposes. It should not be construed as a solicitation or an offer to buy or sell any securities or related financial instruments. No representation or warranty, either expressed or implied, is provided in relation to the accuracy, completeness or reliability of the information contained herein, nor is it intended to be a complete statement or summary of the securities, markets or developments referred to in this article. Rizzo, Farrugia & Co. (Stockbrokers) Ltd (“Rizzo Farrugia”) is under no obligation to update or keep current the information contained herein. Since the buying and selling of securities by any person is dependent on that person’s financial situation and an assessment of the suitability and appropriateness of the proposed transaction, no person should act upon any recommendation in this article without first obtaining investment advice. Rizzo Farrugia, its directors, the author of this article, other employees or clients may have or have had interests in the securities referred to herein and may at any time make purchases and/or sales in them as principal or agent. Furthermore, Rizzo Farrugia may have or have had a relationship with or may provide or has provided other services of a corporate nature to companies herein mentioned. Stock markets are volatile and subject to fluctuations which cannot be reasonably foreseen. Past performance is not necessarily indicative of future results. Foreign currency rates of exchange may adversely affect the value, price or income of any security mentioned in this article. Neither Rizzo Farrugia, nor any of its directors or employees accepts any liability for any loss or damage arising out of the use of all or any part of this article. Additional information can be made available upon request from Rizzo, Farrugia & Co. (Stockbrokers) Ltd., Airways House, Fourth Floor, High Street, Sliema SLM 1551. Telephone: +356 2258 3000; Email: info@rizzofarrugia.com; Website: www.rizzofarrugia.com © 2021 Rizzo, Farrugia & Co. (Stockbrokers) Ltd. All rights reserved. This article may not be reproduced or redistributed, in whole or in part, without the written permission of Rizzo Farrugia. Moreover, Rizzo Farrugia accepts no liability whatsoever for the actions of third parties in this respect.
This article was produced by Edward Rizzo, Director at Rizzo Farrugia, which is a company licensed to undertake investment services in Malta by the MFSA under the Investment Services Act, Cap. 370 of the Laws of Malta and a member of the Malta Stock Exchange. The company’s registered address is at Airways House, Fourth Floor, High Street, Sliema SLM 1551, Malta.