
International equities sway amid volatile market conditions
On 4 February 2016, we had published an article entitled “As January goes, so does the year?”. This article explained the phenomenon of the January barometer. At the time, very few financial analysts, if any, could have expected that by the end of the first quarter, international equity indices were to completely reverse or significantly recover the substantial, multi-year record losses suffered in the first six weeks of 2016.
In the article, we had identified and analysed the most pertinent causes that led international equity indices to register one of the worst starts to the year in recent history. The massive sell-off in Chinese stocks following downbeat economic data led to a worldwide contagion across global equities. Coupled with the weak data from China, there was evident nervous investor sentiment following the interest rate hike in December 2015 by the US Federal Reserve (the first since 2006) and, more significantly, the expectation of a further four rate hikes during the course of 2016.
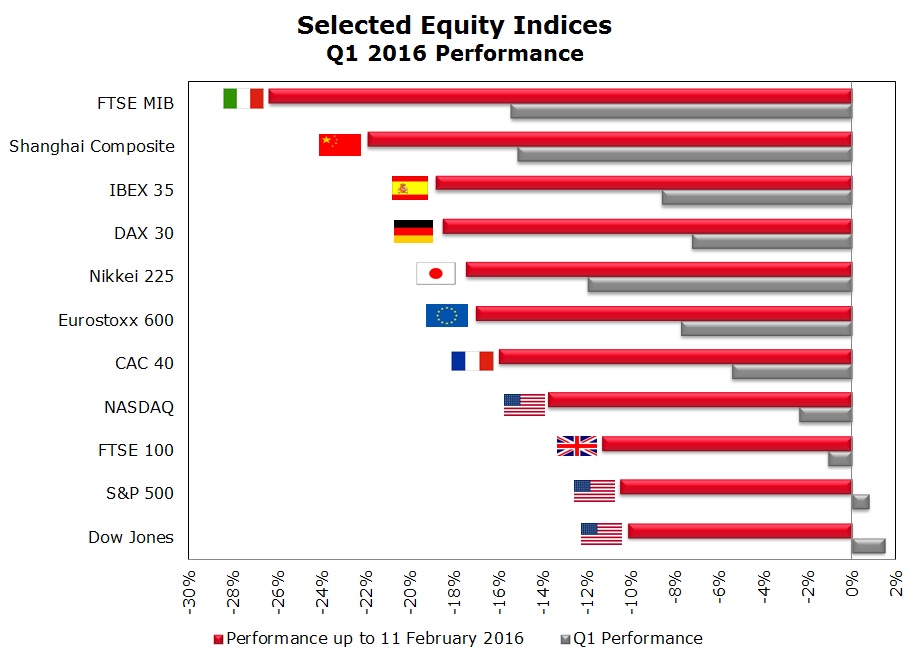
At the peak of pessimism on 11 February 2016, all of the major equity indices were at double-digit losses for the year, with some even entering into bear market territory. In the US, the Dow Jones Industrial Average (DJIA) and the Standard & Poor’s 500 (S&P 500) indices were just over 10% lower since the start of the year, whilst the tech-heavy NASDAQ closed nearly 14% down. The performance across Europe was significantly worse than the US. The benchmark Eurostoxx 600, which represents large, mid and small-capitalised companies across 18 European countries, was 17% lower in the first 6 weeks of the year. Germany’s DAX 30 and Spain’s IBEX 35 were down more than 18% whilst the Italian FTSE MIB was showing a loss of 26%. France’s CAC 40 and UK’s FTSE 100 performed relatively better with losses of 16% and 11% respectively. Further afield, the Chinese Shanghai Composite was down nearly 22% whilst the Japanese Nikkei 225 closed 17% lower.
Despite the significant losses across all major stockmarkets around the world during the first six weeks of the year, there was a substantial recovery between mid-February and end March. In fact, the two main indices in the US (the DJIA and the S&P 500) even managed to recover all losses and moved into positive territory on a year-to-date basis with gains of 1.5% and 0.8% respectively. Also in the US, the NASDAQ still closed Q1 in negative territory with a decline of just over 2% despite the recovery of 13% since 11 February. The positive investor sentiment was also noticeable across European stockmarkets. However, despite an increase of 11% in the Eurostoxx 600 during the latter part of the first quarter, it still ended Q1 with a loss of just below 8%. Similarly, the other main European indices (the FTSE MIB, the DAX 30, the IBEX 35, the CAC 40 and the FTSE 100) all gained between 11% and 15% from their respective closing levels as at 11 February. In contrast, the Shanghai Composite and the Nikkei 225 had the worst relative performance as these two indices “only” recovered by nearly 7% and 9% respectively and closed Q1 at -15% and -12% respectively.
Many investors may therefore question the reasons behind the sharp rebound and the implications for international indices for the rest of the year.
“…the performances of all financial asset classes… are set to remain extremely volatile and highly correlated.”
The roots of the rebound in stock markets go back to 27 January when, during the first meeting for 2016 of the Federal Open Market Committee (FOMC), the US Federal Reserve chief Janet Yellen left interest rates unchanged at between 0.25% and 0.50% and sent out a warning regarding the increased risks to the world’s largest economy stemming from declining global economic growth particularly linked to increased vulnerabilities in emerging market economies including China, a relatively stronger dollar at the time which was at a level of USD1.08 against the euro, and subdued commodity prices (particularly oil).
Seven weeks later, on 16 March, at the subsequent FOMC meeting, the Fed not only left interest rates unchanged for the second consecutive time but, more suggestively, struck a more dovish note and admitted that “global economic and financial developments continue to pose risks … inflation is expected to remain low in the near term … [and] that economic conditions will evolve in a manner that will warrant only gradual increases in the federal funds rate”. This stongly worded statement effectively curbed markets’ expectations for only two interest rate hikes for this year rather than four as at end of December 2015.
As a consequence of the Fed’s renewed dovishness from January’s statement, the value of the US Dollar declined considerably against all major currencies except for the Sterling amid “Brexit” fears. In fact, on 31 March, the US Dollar touched an intra-day, Q1 high against the euro of USD1.14, representing a weakening of 5% against the euro in only 3 months.
A weaker US dollar brings particular relief to emerging economies and to export-oriented multinationals in the US. In the emerging world, a drop in the US Dollar helps commodity prices rise since they are broadly priced in US Dollars. Furthermore, debt-laden companies and institutions operating within emerging economies that, in the past, borrowed heavily in US Dollars find it relatively easier to service their respective commitments. With respect to export-oriented US businesses, a cheaper US Dollar makes their respective exports relatively more competitive, thus supporting higher equity valuations.
Insofar as commodities are concerned, another key turning point that took place mid-way through Q1 was the notable recovery in the price of oil. On 11 February, the spot price of the American benchmark West Texas Intermediate (WTI) hit a thirteen-year low of USD26.19. Barely six weeks after, on 22 March, WTI closed at the USD41.45 level – an uplift of nearly 60% and the highest since mid-November 2015, largely on speculation that a number of oil-producing countries, both members and non-members of the Organisation of the Petroleum Exporting Countries (OPEC), were going to join forces in a coordinated effort at stabilising the price of oil. The high correlation between the performance of global equities and the price of oil has been the subject of countless debates by investment analysts in recent months and the relationship between the two asset classes was very evident again in recent months.
Amid the intense volatility across most asset classes, another very important commodity is gold, which is normally regarded as a safe haven asset in times of turbulence. The price of gold rallied by over 16% in the first quarter of 2016 – the best quarterly performance since the third quarter of 1986. The major part of these gains were registered in the first six weeks of the year, when stock markets were in total turmoil. However, despite the improved investor sentiment since mid-February, the price of gold remained relatively steady until the end of March. The possible reasons for such an astonishing performance are various, perhaps the result of a combination of factors which include diminished US rate-hike expectations, worries about the health of the global economy in general, intensified competitive currency devaluation strategies, renewed geopolitical and terrorism risks and expanded ultra-loose monetary policies, first by the Bank of Japan and, more significantly, by the European Central Bank (ECB).
In fact, hardly a week prior to the FOMC’s second meeting of the year, the ECB announced its most accommodative monetary policy stance when it cut its main refinancing rate by 5 basis points to zero; cut its marginal lending facility rate by 5 basis points to 0.25%; cut its deposit facility rate by 10 basis points to -0.40%; expanded the amount of monthly purchases under the asset purchase programme by a further €20 billion to €80 billion a month; extended its list of assets that are eligible for regular purchases to also incorporate investment grade euro-denominated bonds issued by non-bank corporations established in the euro area; and lastly, launched a new series of four targeted longer-term refinancing operations (TLTRO II), each with a maturity of four years.
The above is of particular significance to local investors given that prices of Malta Government Stocks broadly reflect movements in euro zone yields. In fact, the 10-year benchmark German Yield sank to a low of 0.10% at the end of February compared to 0.64% at the end of 2015. In parallel, the 10-year US counterpart ended December 2015 at the 2.28% level and touched a low of 1.64% also on 11 February. By the end of Q1, both the 10-year German Bund yield and the US Treasury were 48 and 51 basis points lower at 0.16% and 1.77% respectively. The decline in yields sent global bond markets higher.
Meanwhile, amid the rebound across international stock markets, not all indices performed at the same level. Indeed, as noted earlier on, the worst performing indices were those of China and Japan as, despite the numerous interventions by the respective central banks to their economies, dark clouds still continue to shade the dynamics and fundamentals of these two particular economies.
Likewise, European indices underperformed sharply compared to the US, possibly because of the relative underlying strength of the US economy when compared to the continued sluggish recovery across the eurozone; the important influence of the banking sector on European indices (the latest manoeuvres of the ECB at steering the European economy towards growth and inflation may lead to further downward pressures on banks’ earnings prospects), and the overarching deflationary concerns particularly within the Single Currency area. Furthermore, despite the ECB’s heavy intervention at lowering interest rates and contrary to expectations by most analysts, the euro strengthened and acted as a significant burden to the euro zone’s exporting sector.
Going forward, what are the themes which are expected to influence the performance of international equity markets in the months ahead? As already mentioned in some of our previous articles, the statements, actions and any divergence from markets’ expectations by the world’s central banks are likely to continue to be the prime forces impacting global equity indices. Accordingly, the performances of all financial asset classes – equities, commodities, sovereign yields as well as currencies – are set to remain extremely volatile and highly correlated.
Print This Page DisclaimerThe article contains public information only and is published solely for informational purposes. It should not be construed as a solicitation or an offer to buy or sell any securities or related financial instruments. No representation or warranty, either expressed or implied, is provided in relation to the accuracy, completeness or reliability of the information contained herein, nor is it intended to be a complete statement or summary of the securities, markets or developments referred to in this article. Rizzo, Farrugia & Co. (Stockbrokers) Ltd (“Rizzo Farrugia”) is under no obligation to update or keep current the information contained herein. Since the buying and selling of securities by any person is dependent on that person’s financial situation and an assessment of the suitability and appropriateness of the proposed transaction, no person should act upon any recommendation in this article without first obtaining investment advice. Rizzo Farrugia, its directors, the author of this article, other employees or clients may have or have had interests in the securities referred to herein and may at any time make purchases and/or sales in them as principal or agent. Furthermore, Rizzo Farrugia may have or have had a relationship with or may provide or has provided other services of a corporate nature to companies herein mentioned. Stock markets are volatile and subject to fluctuations which cannot be reasonably foreseen. Past performance is not necessarily indicative of future results. Foreign currency rates of exchange may adversely affect the value, price or income of any security mentioned in this article. Neither Rizzo Farrugia, nor any of its directors or employees accepts any liability for any loss or damage arising out of the use of all or any part of this article. Additional information can be made available upon request from Rizzo, Farrugia & Co. (Stockbrokers) Ltd., Airways House, Fourth Floor, High Street, Sliema SLM 1551. Telephone: +356 2258 3000; Email: info@rizzofarrugia.com; Website: www.rizzofarrugia.com © 2021 Rizzo, Farrugia & Co. (Stockbrokers) Ltd. All rights reserved. This article may not be reproduced or redistributed, in whole or in part, without the written permission of Rizzo Farrugia. Moreover, Rizzo Farrugia accepts no liability whatsoever for the actions of third parties in this respect.
This article was produced by Edward Rizzo, Director at Rizzo Farrugia, which is a company licensed to undertake investment services in Malta by the MFSA under the Investment Services Act, Cap. 370 of the Laws of Malta and a member of the Malta Stock Exchange. The company’s registered address is at Airways House, Fourth Floor, High Street, Sliema SLM 1551, Malta.