
Malta’s large caps – a historical perspective
The two equity indices calculated by the Malta Stock Exchange (“MSE”), the MSE Equity Price Index and the MSE Total Return Index, are weighted by the market capitalisation of each of the companies which are listed on the Regulated Main Market (“Official List”). Since share price movements of the larger capitalised companies have a greater influence on the performance of these two indices, financial analysts, fund managers as well as retail and institutional investors should closely monitor changes in the larger constituents of both indices from one period to the next.
Trading on the MSE commenced in January 1992 with less than a handful of equities listed for quite a number of years. In fact, the two large banks, namely HSBC Bank Malta plc and Bank of Valletta plc, were the two dominant equities for the first fifteen years of trading.
Few market observers may recall that HSBC Bank Malta plc is the only local equity to have exceeded a market capitalisation of €2 billion in April 2006 at the peak of Malta’s second strong bull market between October 2002 and April 2006 when the MSE Equity Price Index surged by 380% from 1,747.522 points to its highest level ever of 6,641.873 points. At the time, the share price of Bank of Valletta plc also performed strongly but its market capitalisation never surpassed the €2 billion level and the record market cap of BOV was of €1.3 billion in March 2006. The euphoric investor sentiment at the time that led to such a surge in the market capitalisation of both banks was relatively short-lived. In fact, after reaching €2.03 billion in April 2006, the market cap of HSBC Malta had shrunk to €1.3 billion by the end of 2006 and in a similar fashion, BOV’s market cap declined to €955 million in December 2006 from the peak of €1.3 billion in March 2006.
The value of both banks declined rapidly in 2008/9 at the time of the global financial crisis with the market cap of HSBC dropping by more than half to €607 million by early April 2009 from around €1.4 billion at the start of 2008. Similarly, BOV’s market cap contracted sharply to €320.3 million by mid-March 2009 compared to around €900 million at the start of 2008. Thereafter, however, there was a remarkable recovery in both share prices. In fact, HSBC’s market cap momentarily surpassed the €1 billion mark again in Q1 2010 before ending the year at a level of €950 million. Likewise, BOV’s market cap climbed by almost 25% in 2010 to €771.6 million from €619.2 million as at the end of 2009.
While the movements in the share prices of both banks mirrored each other for most periods until 2010, there was a clear breakthrough in recent years largely as a result of the aggressive de-risking strategy adopted by HSBC Malta which led to a considerable decline in the profitability of the bank and, as a result, also of its market capitalisation. HSBC’s market cap dropped consistently since then to the current value of below €600 million. Meanwhile, BOV’s market cap approached the €1 billion market cap in December 2017 following the €150 equity injection via a rights issue but then dropped to circa €700 million in recent months.
The dominance of the two large banks has been diluted over the past 10 years both as a result of the decline in the market cap of the two large banks as well as the admission of new companies over the years and also the extraordinary growth in the market capitalisation of some other companies. It is therefore interesting to analyse how the composition of the Maltese equity market has changed since the early 2000’s. This is especially important for those investors seeking to mirror the composition of the index in their investment portfolios.
As the valuations of the banks declined in recent years, one company in particular – namely Malta International Airport plc – saw its market cap rise consistently helping it to become the largest capitalised company in Malta. This ranking is based on the total issued share capital of the company. Unfortunately, the equity indices computed by the MSE only take into consideration the ‘A’ shares of the airport operator since in 2002, when the Government of Malta made a public offer of MIA shares, only the ‘A’ shares were listed on the MSE. Since the ‘A’ shares represent 60% of the total issued share capital, the weighting of MIA in the MSE equity indices is distorted as it does not reflect the true value of the company. In this respect, few investors may realise the extent of the rise in MIA’s valuation from €243.5 million at the start of 2013 to just under €900 million today.
With MIA currently being recognised as the largest listed company when taking into account its entire issued share capital followed by BOV and HSBC, the fourth largest capitalised company is currently GO plc. The weighting of GO has fluctuated over the years in line with the volatility caused by their ill-fated investment in the Greek telecoms company Forthnet S.A. some years ago which has, since then, been completely written-off from the books of GO. From a market cap of around €320 million at the start of 2008 before the investment in Forthnet, the market cap of GO declined to €72 million in May 2012 but has since grown to €500 million. Meanwhile, it is worth noting that the market cap of GO today excludes the value of Malta Properties Company plc which was spun-off in November 2015 (MPC has a market cap of €57 million today) as well as the 49% shareholding of BMIT Technologies plc (equivalent to €53 million) which GO sold through an IPO earlier this year.
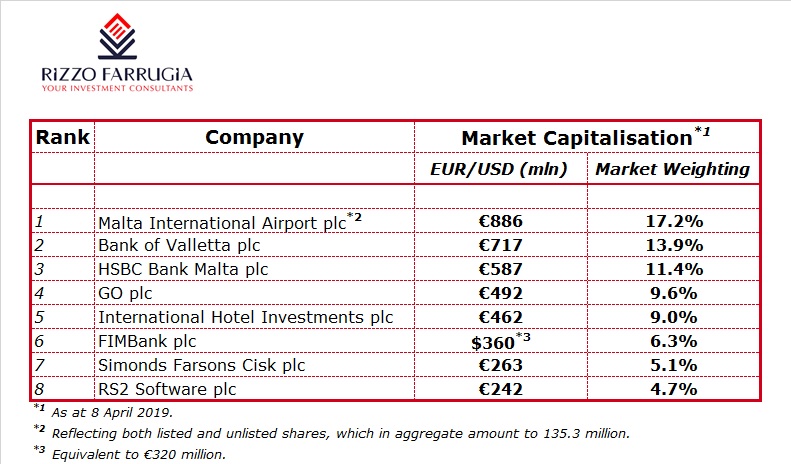
The market cap of IHI had grown remarkably in 2007 as a result of the significant equity injection by the Dubai sovereign wealth fund to around €560 million as at the end of 2007, placing the company as the third largest on the MSE at the time behind the two dominant banks and ahead of GO. However, IHI’s market cap declined to below €400 million over the past three years but recently resurfaced above the €400 million mark again as the share price rallied by over 20% since the start of 2019. IHI is currently the 5th largest company in Malta accounting for 9% of the benchmark indices.
FIMBank plc’s market cap also fluctuated sharply over the years first as a result of the significant losses incurred between 2013 and 2015 and more recently following the equity injection as part of a USD105 million rights issue in the first half of 2018. The current market cap of FIMBank stands at circa €320 million which translates into an overall weighting of 6.3%.
Two companies in particular experienced a spectacular increase in their market caps over the past 10 years leading to an increased weighting in the equity indices and a corresponding dilution in the weighting of the large caps. The market cap of Simonds Farsons Cisk plc grew from just under €50 million at the start of 2009 to over €260 million today as the company’s profitability grew significantly over the years. Farsons is today the 7th largest company on the MSE with a weighting of 5%. The increase in the market cap of Farsons must also be seen in the light of the spin-off of its former property subsidiary Trident Estates plc which currently has a market cap of €40 million. This once again shows the success of such corporate actions in generating additional shareholder value.
The shares of RS2 Software plc had been admitted to the equity market in the first half of 2008 valuing the company at €30 million. The company’s market cap had fallen in the first two years to below €20 million but grew spectacularly to a record of €364.5 million in March 2016 reflecting a number of breakthroughs including the announcement in August 2013 that Barclays Bank plc acquired a BankWORKS® licence and subsequently also became the second largest shareholder of RS2 with a current stake of 18.25%. More recently, the market value of RS2 was much more volatile, reflecting the company’s change in business model. Today, the market cap of RS2 stands at just over €240 million resulting in a weighting of 4.7%.
Another reason for the dilution in the weighting of the large caps over the years was due to the addition of new companies listed on the MSE. It is worth highlighting two IPO’s in particular in recent years since they were relatively large in size with a market cap of €100 million or over upon flotation. PG plc was admitted to the Regulated Main Market in the first half of 2017 with a market cap of €108 million and which has since grown to €154 million thereby accounting for a weighting of 3% of the overall market. Likewise, the IPO of BMIT Technologies plc earlier this year with a market cap of €100 million and which has since increased to €108 million gives a current weighting of 2.1%.
The analysis of the changes in the market caps of various companies over the past years indicates how the fortunes of a company may change as a result of strategic achievements or mishaps as well as the evolving macroeconomic landscape. This is the reason for the need for regular portfolio reviews for those clients who do not have discretionary portfolio mandates in place with their financial advisors and thereby still exercise control over their investment decisions.
It may take a very long time for a Maltese company to attain a market cap of €2 billion again as HSBC had done in 2006. On the other hand, the €1 billion level is well within reach for MIA. Will it be the airport operator to achieve this important €1 billion milestone or will there be a surprising rally in an equity that can surpass MIA to this notable achievement?
Print This Page DisclaimerThe article contains public information only and is published solely for informational purposes. It should not be construed as a solicitation or an offer to buy or sell any securities or related financial instruments. No representation or warranty, either expressed or implied, is provided in relation to the accuracy, completeness or reliability of the information contained herein, nor is it intended to be a complete statement or summary of the securities, markets or developments referred to in this article. Rizzo, Farrugia & Co. (Stockbrokers) Ltd (“Rizzo Farrugia”) is under no obligation to update or keep current the information contained herein. Since the buying and selling of securities by any person is dependent on that person’s financial situation and an assessment of the suitability and appropriateness of the proposed transaction, no person should act upon any recommendation in this article without first obtaining investment advice. Rizzo Farrugia, its directors, the author of this article, other employees or clients may have or have had interests in the securities referred to herein and may at any time make purchases and/or sales in them as principal or agent. Furthermore, Rizzo Farrugia may have or have had a relationship with or may provide or has provided other services of a corporate nature to companies herein mentioned. Stock markets are volatile and subject to fluctuations which cannot be reasonably foreseen. Past performance is not necessarily indicative of future results. Foreign currency rates of exchange may adversely affect the value, price or income of any security mentioned in this article. Neither Rizzo Farrugia, nor any of its directors or employees accepts any liability for any loss or damage arising out of the use of all or any part of this article. Additional information can be made available upon request from Rizzo, Farrugia & Co. (Stockbrokers) Ltd., Airways House, Fourth Floor, High Street, Sliema SLM 1551. Telephone: +356 2258 3000; Email: info@rizzofarrugia.com; Website: www.rizzofarrugia.com © 2021 Rizzo, Farrugia & Co. (Stockbrokers) Ltd. All rights reserved. This article may not be reproduced or redistributed, in whole or in part, without the written permission of Rizzo Farrugia. Moreover, Rizzo Farrugia accepts no liability whatsoever for the actions of third parties in this respect.
This article was produced by Edward Rizzo, Director at Rizzo Farrugia, which is a company licensed to undertake investment services in Malta by the MFSA under the Investment Services Act, Cap. 370 of the Laws of Malta and a member of the Malta Stock Exchange. The company’s registered address is at Airways House, Fourth Floor, High Street, Sliema SLM 1551, Malta.