
The largest capitalised company on the MSE
Both indices calculated by the Malta Stock Exchange (MSE), the MSE Equity Price Index and the MSE Total Return Index, are weighted by the market capitalisation of each of the various constituents of the indices, namely all the companies whose equities are listed on the regulated main market (namely the Official List).
The performances of both benchmark indices are monitored continuously by financial analysts as well as many investors to gauge movements across the local equity market from one period to another and also to compare the equity market to other asset classes such as bonds, property, etc. Moreover, the indices are also monitored regularly by institutional investors who compare the performance of their collective investment schemes and other client portfolios to the overall equity market.
The MSE Equity Price Index and the MSE Total Return Index are also important benchmarks in order to compare the performance of the Maltese equity market to the larger international markets since most Maltese investors also have an allocation to international equities and bonds in their investment portfolios.
Due to the varied uses of the equity benchmarks calculated by the MSE, it is important for investors to understand what drives such movements in the indices. Since the indices are based on the market capitalisation of each of the underlying components, naturally a change in the share price of the larger capitalized companies has a larger impact on the overall movement in the indices compared to the same percentage movement of a smaller capitalized company.
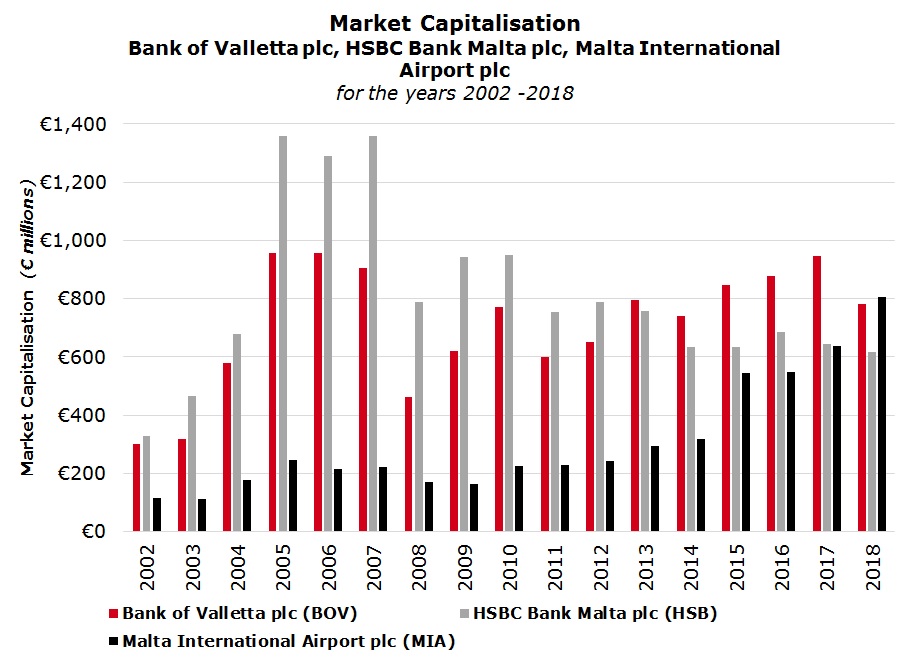
Traditionally, HSBC Bank Malta plc and Bank of Valletta plc dominated the weighting of the equity benchmark and the movements in the MSE Equity Price Index were mainly due to changes in the share prices of both banks. However, their dominance has weakened in recent years both as a result of new additions to the market which diluted their weighting as well as due to the outperformance of several companies compared to declines registered in the equities of these banks. This led to a much higher market capitalisation for other companies compared to a static or declining market cap for BOV and HSBC.
In fact, few analysts and investors may recall that the market cap of HSBC Bank Malta plc had exceeded the €2 billion level in April 2006 at the time of the second bull market for the Maltese equity market. However, HSBC’s share price had corrected quickly soon afterwards and the market cap had shrunk to €1.3 billion by the end of 2006. In 2008, at the time of the global financial crises, the market cap of HSBC Malta had dropped below €800 million but recovered towards the €1 billion level again in 2010. Since then, HSBC’s market cap declined considerably as a result of the lower level of profitability following the de-risking strategy adopted by the bank.
BOV’s market capitalisation mirrored that of HSBC until a few years ago and in fact it had reached a record market cap of €1.3 billion in March 2006 before easing to €955 million at the end of 2006 and shrinking remarkably to just €462 million at the end of 2008 amid the global financial crises. BOV’s market capitalisation had then recovered to almost €800 million by the end of 2010 and following a renewed downturn in 2010 and 2011, it had surpassed the €1 billion level in March 2018. However, it has since declined to below €800 million following the unexpected announcement in mid-March regarding the Italian court case and more importantly as a result of the decision by the bank on 31 July to suspend dividends to shareholders for the current financial year ending 31 December 2018 in view of a litigation provision of €75 million accounted for in the interim financial statements.
While the market caps of the two large banks have fluctuated in recent years and dropped to well below their record levels, on the other hand, Malta International Airport plc continued to experience a rally in its share price to new record levels as passenger traffic continued to surge resulting in a sizeable growth in the company’s market cap.
However, the calculation of the market capitalisation of MIA may be confusing to some investors.
In 2002, when the Government of Malta had made a public offer of 20% of the issued share capital of MIA, only the ‘A’ shares of MIA were listed on the MSE (totaling 81,179,990 shares and representing 60% of the issued share capital) since a few months earlier the ‘B’ shares (representing 40% of the issued share capital) were transferred to Malta Mediterranean Link Consortium.
The Government of Malta had offered a further block of 20% of MIA through the sale of more ‘A’ shares in November 2005 when VIE Malta Ltd had directly acquired just over 10% of the overall issued share capital through the acquisition of ‘A’ shares.
Since only the ‘A’ shares of MIA are listed on the MSE, few investors and analysts may actually take into consideration the overall number of shares in issue when calculating the market capitalisation of MIA. In fact, even the MSE only takes the ‘A’ shares into consideration for the calculation of its Equity Price Index and the Total Return Index and as such, MIA’s weighting in the indices equates to just over 11%.
However, it would be fair to base one’s calculation on the entire issued share capital of MIA (amounting to 135.3 million shares) rather than only on the ‘A’ shares. Using the total issued share capital would imply that MIA’s market capitalisation of €805 million currently exceeds the market capitalisation of BOV at €780 million (based on the prices as at the close of trading on 17 September 2018). As such, MIA would therefore be classified as the largest company on the MSE with a weighting of over 17%.
For investors who had bought MIA shares during the Initial Public Offering in 2002, it is worth highlighting that the share price has since risen by 249.9% during the past 16 years which equates to an average annual return of 15.6% excluding the regular semi-annual dividends.
The significant increase in MIA’s share price (and therefore its market cap) over the years reflects the significant improvement in the company’s financial performance arising from the remarkable surge in passenger traffic as well as the investment undertaken in the surrounding area forming part of the terminal. In recent years, MIA has also been publishing its passenger and financial forecast and the company is projecting EBITDA of over €53 million for 2018 which would represent a growth of over 9% compared to the 2017 actual EBITDA of €48.5 million.
Moreover, going forward, the company’s profitability could continue to rise following last week’s news of the significant additional capacity being deployed by Ryanair during the summer of 2019.
The equity indices drawn up by the MSE (namely the Equity Price Index and the Total Return Index) should be adjusted to reflect the total issued share capital of MIA in order to take this important achievement into consideration and depict a better picture of the situation for the investing public.
Print This Page DisclaimerThe article contains public information only and is published solely for informational purposes. It should not be construed as a solicitation or an offer to buy or sell any securities or related financial instruments. No representation or warranty, either expressed or implied, is provided in relation to the accuracy, completeness or reliability of the information contained herein, nor is it intended to be a complete statement or summary of the securities, markets or developments referred to in this article. Rizzo, Farrugia & Co. (Stockbrokers) Ltd (“Rizzo Farrugia”) is under no obligation to update or keep current the information contained herein. Since the buying and selling of securities by any person is dependent on that person’s financial situation and an assessment of the suitability and appropriateness of the proposed transaction, no person should act upon any recommendation in this article without first obtaining investment advice. Rizzo Farrugia, its directors, the author of this article, other employees or clients may have or have had interests in the securities referred to herein and may at any time make purchases and/or sales in them as principal or agent. Furthermore, Rizzo Farrugia may have or have had a relationship with or may provide or has provided other services of a corporate nature to companies herein mentioned. Stock markets are volatile and subject to fluctuations which cannot be reasonably foreseen. Past performance is not necessarily indicative of future results. Foreign currency rates of exchange may adversely affect the value, price or income of any security mentioned in this article. Neither Rizzo Farrugia, nor any of its directors or employees accepts any liability for any loss or damage arising out of the use of all or any part of this article. Additional information can be made available upon request from Rizzo, Farrugia & Co. (Stockbrokers) Ltd., Airways House, Fourth Floor, High Street, Sliema SLM 1551. Telephone: +356 2258 3000; Email: info@rizzofarrugia.com; Website: www.rizzofarrugia.com © 2021 Rizzo, Farrugia & Co. (Stockbrokers) Ltd. All rights reserved. This article may not be reproduced or redistributed, in whole or in part, without the written permission of Rizzo Farrugia. Moreover, Rizzo Farrugia accepts no liability whatsoever for the actions of third parties in this respect.
This article was produced by Edward Rizzo, Director at Rizzo Farrugia, which is a company licensed to undertake investment services in Malta by the MFSA under the Investment Services Act, Cap. 370 of the Laws of Malta and a member of the Malta Stock Exchange. The company’s registered address is at Airways House, Fourth Floor, High Street, Sliema SLM 1551, Malta.