
Another positive year for the Maltese equity market
Following the exceptional performance of the MSE Share Index in 2015 when the equity market rallied by 33%, the Index advanced by a more modest 4.5% in 2016.
The MSE Share Index is composed of the 22 equities listed on the Official List of the Malta Stock Exchange. As I explained on various occasions in the past, it is weighted according to the market capitalisation of the company with Bank of Valletta plc being the largest component of the Index followed by HSBC Bank Malta plc. Meanwhile, Santumas Shareholdings plc represents the smallest contribution to the Index since its market capitalisation is of under €6 million. As such, the movements in the share prices of the larger companies have a larger impact on the performance of the overall Index.
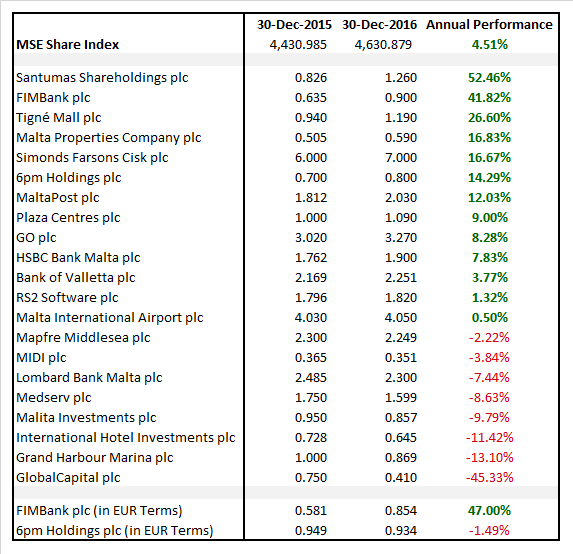
Among the 22 companies, there were 13 positive performers while 8 companies experienced a decline in their respective share price during the past twelve months. Among the 13 positive performers, there were 7 companies that registered double-digit gains. Likewise, among the negative performers, 3 equities registered double-digit losses.
Another important measure is the overall trading activity across the equity market. In 2015, trading volumes had surged by 60.5% over the previous year to €81.5 million which was the highest level of turnover since 2006. During 2016, activity across the equity market declined by merely 4.5% to €77.8 million which is still a positive indicator compared to the volumes pre-2015. This is even more significant when one also takes into account the fact that unfortunately there were no new additional equities admitted to listing on the MSE in 2016.
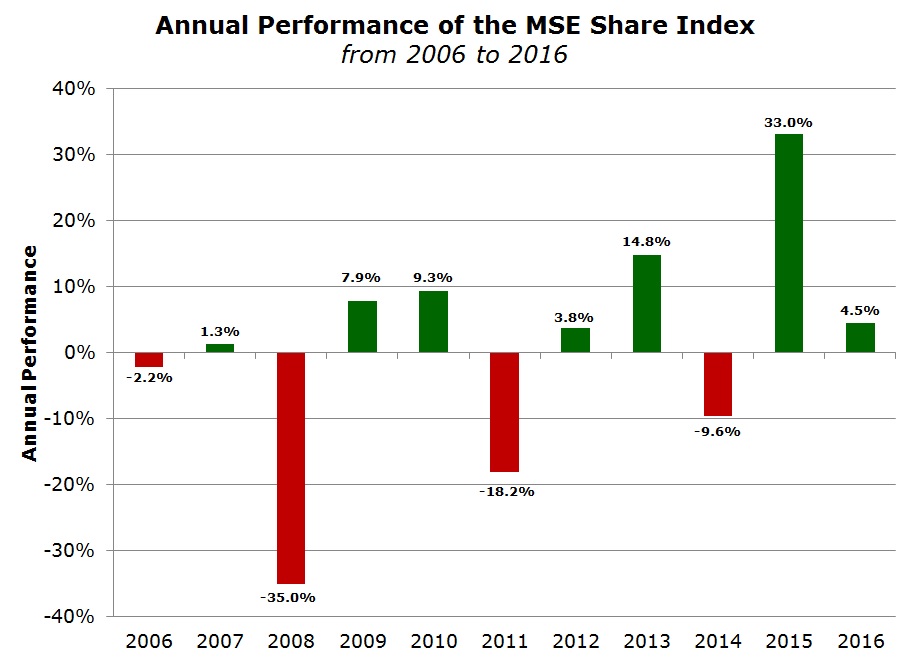
Although overall the MSE Share Index registered its second consecutive positive year, once again there were varying performances among the 22 equities. Moreover, it is worth highlighting that the Index performed positively during the first three months of the year and also during the final quarter of the year whereas between April and September, the equity market declined.
The top performer was Santumas Shareholdings plc with a rise of 52.5%. However, as I explained above, this had a marginal impact on the overall performance on the Index due to the very low market capitalisation of the company. Moreover, this notable increase took place on very low activity with a value of only €156,000 worth of shares changing hands.
FIMBank plc was another star performer during the past twelve months with an increase of 41.8% as the equity continued to recover following the significant declines in previous years to an all-time low of USD0.376 in March 2015. FIMBank’s equity had advanced by 21% in 2015. Since the equity of FIMBank is denominated in US Dollars, it is interesting for local investors to note that in euro terms, the performance improves by more than 5 percentage points to 47.0% as a result of the strengthening of the US Dollar against the euro during 2016.
The effect of foreign exchange movements should never be underestimated. In fact, while local investors who converted euros into US Dollars to acquire FIMBank shares also gained on the exchange rate, the same does not apply to 6pm Holdings plc. Although the share price of 6pm advanced by 14.3% during 2016 to GBP0.80 (after trading up to a record of GBP1.00 on 2 May shortly after the publication of the 2015 financial statements), in euro terms the performance of 6pm’s equity drops to -1.5% as a result of the 10% decline in the value of Sterling following the 23rd June Brexit referendum.
After almost doubling in value during 2015, Simonds Farsons Cisk plc saw its share price gain a further 16.7% to €7.00 after reaching a fresh record level of €7.30 on 3 October. A total of 405,000 SFC shares changed hands this year for a value of €2.6 million, representing only 3.4% of overall trading activity. The low volumes is representative of the free float of only 20.68% given the stake of the three family companies holding over 79% of the total issued share capital of Farsons.
Possibly, one of the major suprises in terms of share price movements in 2016 was Tigne’ Mall plc whose equity climbed by a further 26.6% during the past twelve months following the 56.7% rally during 2015. The company continued to perform positively and maintained its semi-annual dividend policy.
Other companies that registered double-digit gains were Malta Properties Company plc (+16.8%) and MaltaPost plc (+12%). The most important announcement of Malta Properties took place on 3 October, when the company revealed that it entered into a tripartite Memorandum of Understanding regarding a proposed development at its site in St Julian’s. Malta Properties will have a 50% stake in the shopping mall forming part of the mixed-use development which is expected to be completed by 2023.
In the retail banking sector, HSBC Bank Malta plc outperformed Bank of Valletta plc for the first time in several years. The share price of HSBC advanced by 7.8% during the past twelve months while BOV’s equity edged 3.8% higher. HSBC’s share price declined by 10.3% during the first quarter of 2016 and reached a fresh 12-year low of €1.55 but recovered strongly during the final three months of the year. Meanwhile, the share price of BOV was among the least volatile this year as it traded between a high of €2.339 and a low of €2.169. Lombard Bank Malta plc was among the negative performers this year with a decline of 7.4% to €2.30 after touching an intra-day low of €1.95 on 13 June.
One of the major developments during 2016 was the takeover of GO plc by TT ML Limited (a fully owned subsidiary of Tunisie Telecom). After Tunisie Telecom was selected as the preferred bidder in May, TT ML Limited launched a voluntary public offer to all GO plc shareholders at €2.87 per share. The share price had rallied by 14% to €3.45 during the first quarter of the year in anticipation of the takeover, but dropped to a low of €2.75 on 24 May – the day when the price offered by the preferred bidder was announced. TT ML Limited received acceptances totalling 66,281,050 shares – representing approximately 65.4% of the entire issued share capital of GO. Following the closure of the voluntary offer and the publication of the interim financial statements showing a strong improvement in EBITDA (mainly as a result of the consolidation of revenues generated from the now majority-controlled Cypriot telecoms subsidiary Cablenet), the share price of GO recovered from its 2016 low and ended the year with an overall gain of 8.3%.
A number of equities rallied to fresh record levels but then registered a correction in their share prices. Between 2011 and 2015, the share price of RS2 Software plc was among the top performers on a yearly basis and this very positive trend continued during the first few weeks of 2016 as RS2’s equity rallied by 28.2% to a record of €2.302 on 11 March. The equity has been particularly volatile since then and dropped to a low of €1.40 on 27 October before recovering by 30% to end the year at €1.82 (representing an uplift of only 1.3% over 2015). Trading activity in RS2 shares was extraordinary in the past twelve months and it ranks as the second most actively traded equity. A total of 6.2 million shares traded for a value of €16.2 million, representing 21% of the overall activity across the equity market.
The share price of Malta International Airport plc was less volatile than that of RS2 but followed a similar pattern as following the 71.5% rally in 2015, the equity climbed by a further 18.1% during the first few weeks of 2016 to a record of €4.76 on 24 February shortly before the publication of the 2015 financial statements. However, the share price declined after the publication of the results possibly due to the reduction in the final dividend to shareholders. Since then, the company has kept the market regularly informed on the passenger traffic passing through the terminal on a monthly basis and has also published its financial results for the nine-month period to 30 September 2016 as part of its Interim Directors Statement in November. During the first nine months of 2016, MIA’s EBITDA improved by 7.4% to €32.04 million and net profit edged 10% higher to €17.07 million. Moreover, MIA recently confirmed that over 5 million passengers passed through the terminal until 20 December 2016. Following this achievement, MIA should be registering an increase of over 10% in passenger traffic compared to the record figure of 2015. MIA has therefore once again exceeded its passenger forecast.
Although it is always interesting to review the share price performances at the end of the year, many investors would rightly be more interested to understand the outlook for the next 12 months. As usual, the overall equity market performance will be dependent on a number of company-specific developments. I will provide some details on a number of these expected developments in one of my upcoming articles over the next few weeks.
Print This Page DisclaimerThe article contains public information only and is published solely for informational purposes. It should not be construed as a solicitation or an offer to buy or sell any securities or related financial instruments. No representation or warranty, either expressed or implied, is provided in relation to the accuracy, completeness or reliability of the information contained herein, nor is it intended to be a complete statement or summary of the securities, markets or developments referred to in this article. Rizzo, Farrugia & Co. (Stockbrokers) Ltd (“Rizzo Farrugia”) is under no obligation to update or keep current the information contained herein. Since the buying and selling of securities by any person is dependent on that person’s financial situation and an assessment of the suitability and appropriateness of the proposed transaction, no person should act upon any recommendation in this article without first obtaining investment advice. Rizzo Farrugia, its directors, the author of this article, other employees or clients may have or have had interests in the securities referred to herein and may at any time make purchases and/or sales in them as principal or agent. Furthermore, Rizzo Farrugia may have or have had a relationship with or may provide or has provided other services of a corporate nature to companies herein mentioned. Stock markets are volatile and subject to fluctuations which cannot be reasonably foreseen. Past performance is not necessarily indicative of future results. Foreign currency rates of exchange may adversely affect the value, price or income of any security mentioned in this article. Neither Rizzo Farrugia, nor any of its directors or employees accepts any liability for any loss or damage arising out of the use of all or any part of this article. Additional information can be made available upon request from Rizzo, Farrugia & Co. (Stockbrokers) Ltd., Airways House, Fourth Floor, High Street, Sliema SLM 1551. Telephone: +356 2258 3000; Email: info@rizzofarrugia.com; Website: www.rizzofarrugia.com © 2021 Rizzo, Farrugia & Co. (Stockbrokers) Ltd. All rights reserved. This article may not be reproduced or redistributed, in whole or in part, without the written permission of Rizzo Farrugia. Moreover, Rizzo Farrugia accepts no liability whatsoever for the actions of third parties in this respect.
This article was produced by Edward Rizzo, Director at Rizzo Farrugia, which is a company licensed to undertake investment services in Malta by the MFSA under the Investment Services Act, Cap. 370 of the Laws of Malta and a member of the Malta Stock Exchange. The company’s registered address is at Airways House, Fourth Floor, High Street, Sliema SLM 1551, Malta.