
Explaining the yield curve
Last month, global equity markets skidded when new inflationary data in the US sparked fears that an accelerated rate of increase in wages in the world’s largest economy, coupled with the introduction of expansionary fiscal measures, could push the Federal Reserve to accelerate the pace of its monetary policy normalisation and, as a result, bring the era of cheap money closer to an end. In reaction, bond yields across the world rose to their highest levels in several months whilst bond prices slumped. In particular, the benchmark 10-year German Bund yield jumped to 0.81% – the highest level since early September 2015 – and the 10-year US Treasury yield climbed to a four-year high of 2.96%. Moreover, several economists and analysts warned about the negative macroeconomic implications generally associated with the flattening of bond yield curves.
Although local income-oriented investors tend to be fairly familiar with certain terminology used in finance related to fixed-income securities – such as “coupon”, “yield-to-maturity”, and “complex” or “plain vanilla” bonds – on the other hand, few tend to understand what “yield curves” typically stand for, and how they can be used for assessing the case of investing in the bond market.
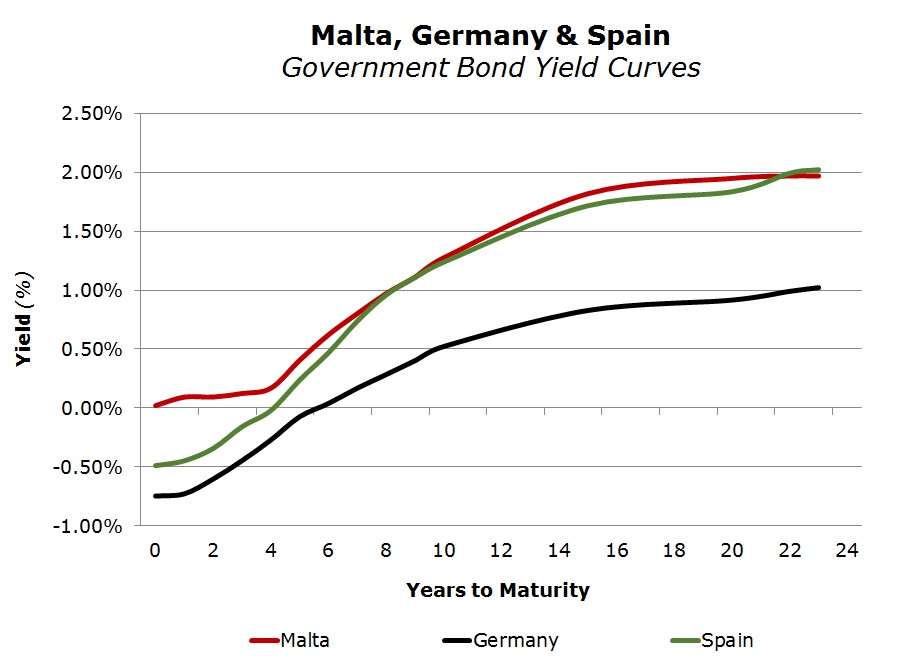
A yield curve is a graphical representation typically showing the yields of bonds issued by the same issuer across various maturities. By way of example, the red line in the chart shows the yield curve for Malta Government Stocks based on the opening indicative bid prices of the Central Bank of Malta. It has an upward-sloping, or “normal”, shape which in turn reflects the fact that yields on MGS’s increase with as the term to maturity lengthens in view of the added risks associated with holding on to longer-dated securities. In this respect, however, it is also worth highlighting the lower gradient at the shorter and longer end of the MGS yield curve when compared to the much higher slope between the fifth and the fifteenth year of the MGS maturity scale. In this particular example, the yield curve is clearly showing that the marginal returns that an investor is getting for the added risks when investing in the longest dated MGS in issue – i.e. the 2.40% MGS 2041 which currently has a yield of 1.97% – are relatively minimal when compared to the yield of 1.89% on an MGS that matures six years earlier. In contrast, the MGS yield curve also shows that the current average returns of 0.62% for investing in an MGS that matures in six years’ time (2024) are more than three-and-a-half times the average returns of 0.17% when investing in an MGS that matures in 2022.
Yield curves are also used when comparing the relative attractiveness of bonds of various issuers with different credit profiles, ratings, and risks. Moreover, a yield curve may also include bonds having different features or characteristics. In this respect, the chart shows how the MGS yield curve compares with the corresponding yields of bonds issued by the central governments of Germany and Spain. Within the single currency area, German Bunds are regarded as the “risk-free” benchmark and the yields of all other euro area sovereign bonds are measured against this benchmark. The additional yield between one sovereign bond and the German benchmark is referred to as the “premium” or “spread” – in other words, an additional compensation in the form of a higher yield. In the chart, this is seen by the higher yields of both MGS and Spanish government bonds when compared to German Bunds.
In contrast, it is interesting to note that despite the fact that the international credit rating agencies Moody’s and FitchRatings assign a better credit rating to Malta than Spain (and therefore deemed to be less risky), the yields on MGS’s are generally higher than those of Spanish government bonds. This is mostly evident at the shorter end of the yield curve. As such, based on the credit risk assessments of both Moody’s and FitchRatings, the MGS yield curve ought to be below the Spanish government yield curve to reflect the lower credit rating of Spain when compared to that of Malta.
On the other hand, however, the credit rating of Spain by Standard & Poor’s has very recently been lifted to “A-“ (the highest since 2012) which is at par with Malta’s credit rating by the same agency. Essentially, according to the world’s foremost credit rating agency, investing in bonds issued by the governments of Malta and Spain now carry the same level of credit risk. As a result, the MGS and the Spanish government bond yield curves should, in theory, be lying precisely over each other which, then again, is not the case in reality.
One of the reasons for market anomalies is the determination of MGS prices and yields by the Central Bank of Malta which is a unique method compared to other Eurozone countries. The Central Bank of Malta publishes indicative bid prices across the MGS market since it is committed to purchase securities that will be placed on offer by retail as well as institutional investors. The Central Bank of Malta has never published the criteria used for determining the yields and prices on MGS’s. However, it is evident that movements in MGS’s are largely influenced by movements in the benchmark German Bund yield curve as well as movements in yields of other countries with similar credit ratings to Malta.
From a broader perspective, yield curves are also regarded as a reflection of expected changes in monetary policy and economic conditions (namely inflation and growth). For example, an “inverted” yield curve reflects a situation where short-term yields (or interest rates) are higher than those at the longer end of the yield curve. This situation is mostly interpreted as a sign of an upcoming economic recession and, in fact, was one of the main concerns underpinning the global equity market sell-off last month. Although a yield curve inversion is indeed a rare occurrence, data shows that the US Treasury yield curve did actually invert ahead of each of the past seven economic recessions.
Conversely, a “flattening” yield curve is normally associated with an economy in transition, either from economic expansion (upward-sloping yield curve) to contraction (inverted yield curve), or vice versa. In the case where economic growth and/or inflation are expected to slow in the future, yields at the shorter and the longer end of the yield curve tend to move in opposite directions as investors seek to take increased exposure to longer-dated bonds at the expense of shorter-dated ones. On the contrary, when an economy is transitioning from a recessionary period to an expansion cycle, coupled with a brighter inflationary outlook, the case for investing in long-term bonds in general becomes much less attractive.
In the wake of the 2008/09 international financial crisis, the world’s most influential central banks took coordinated emergency actions aimed at restoring global financial and economic order. Today, notwithstanding the many threats stemming from the introduction of disruptive trade barriers in the US, the world economy is riding on what the International Monetary Fund recently described as the “broadest synchronised global growth upsurge since 2010.” Central banks are now reversing some of the extraordinary measures put into place some years ago in order to restore monetary policy normalisation. As such, as volatility in bond yields is expected to remain high in the months and years ahead, local investors must seek financial advice to ensure that their portfolios reflect the upcoming economic and monetary developments.
Print This Page DisclaimerThe article contains public information only and is published solely for informational purposes. It should not be construed as a solicitation or an offer to buy or sell any securities or related financial instruments. No representation or warranty, either expressed or implied, is provided in relation to the accuracy, completeness or reliability of the information contained herein, nor is it intended to be a complete statement or summary of the securities, markets or developments referred to in this article. Rizzo, Farrugia & Co. (Stockbrokers) Ltd (“Rizzo Farrugia”) is under no obligation to update or keep current the information contained herein. Since the buying and selling of securities by any person is dependent on that person’s financial situation and an assessment of the suitability and appropriateness of the proposed transaction, no person should act upon any recommendation in this article without first obtaining investment advice. Rizzo Farrugia, its directors, the author of this article, other employees or clients may have or have had interests in the securities referred to herein and may at any time make purchases and/or sales in them as principal or agent. Furthermore, Rizzo Farrugia may have or have had a relationship with or may provide or has provided other services of a corporate nature to companies herein mentioned. Stock markets are volatile and subject to fluctuations which cannot be reasonably foreseen. Past performance is not necessarily indicative of future results. Foreign currency rates of exchange may adversely affect the value, price or income of any security mentioned in this article. Neither Rizzo Farrugia, nor any of its directors or employees accepts any liability for any loss or damage arising out of the use of all or any part of this article. Additional information can be made available upon request from Rizzo, Farrugia & Co. (Stockbrokers) Ltd., Airways House, Fourth Floor, High Street, Sliema SLM 1551. Telephone: +356 2258 3000; Email: info@rizzofarrugia.com; Website: www.rizzofarrugia.com © 2021 Rizzo, Farrugia & Co. (Stockbrokers) Ltd. All rights reserved. This article may not be reproduced or redistributed, in whole or in part, without the written permission of Rizzo Farrugia. Moreover, Rizzo Farrugia accepts no liability whatsoever for the actions of third parties in this respect.
This article was produced by Edward Rizzo, Director at Rizzo Farrugia, which is a company licensed to undertake investment services in Malta by the MFSA under the Investment Services Act, Cap. 370 of the Laws of Malta and a member of the Malta Stock Exchange. The company’s registered address is at Airways House, Fourth Floor, High Street, Sliema SLM 1551, Malta.