
The DOW @ 20,000
Although the headlines that dominated the international media last week related to the first few days in office of the new US President Donald Trump, the international financial media gave ample exposure to the fact that one of the main equity indices in the US – the Dow Jones Industrial Average (“DJIA”) – surpassed the 20,000 level for the first time ever.
Indeed, the origins of the DJIA, more commonly referred to simply as the “Dow”, go back some 130 years when American financial journalists Charles H. Dow and Edward Jones came up with the idea of creating an average reflecting the overall performance of the US equity market. Today, together with the S&P 500 and the tech-heavy NASDAQ Composite, the Dow is one of the most closely-watched indices in the US and across the entire financial world.
The Dow is composed of only 30 blue-chip American companies considered to be titans in their respective fields of operation. In aggregate, these 30 companies have a market capitalisation of over USD5.7 trillion, generate annual revenues of over USD2.7 trillion and employ over 6.5 million people. Among the Dow’s constituents, there are some very familiar names like Coca-Cola, Apple, IBM, McDonald’s, Microsoft, Nike and Visa. These are just a few of the companies included in the index. Most of the products and services of these 30 companies naturally feature prominently in the daily lives of most people across the world.
Furthermore, the top three Fortune 500 companies – which is a list of the most revenue- generating companies in the world representing approximately two-thirds of the gross domestic product (GDP) of the US – are also included in the Dow. These are the world’s largest private employer – Walmart; the American multi-national oil and gas corporation ExxonMobil; and Apple – the most valuable company in the world with a market capitalisation of over USD600 billion.
One of the interesting but mostly criticised features of the Dow is that it is a price-weighted market index and as such, it is impacted more by the movements in the share prices of companies which have a higher absolute share price than by others whose share price is lower-priced. Therefore, the Dow does not reflect the actual average of the share prices of its various components as is the case with most other indices across the world.
In view of the highly critical weighting by share price rather than by market capitalisation, the weighting of Goldman Sachs, for example, is eight times more than that of General Electric (Dow’s oldest component), even though GE has roughly triple the market cap of Goldman. This is due to the fact that the share price of Goldman Sachs trades at circa USD240 while General Electric’s share price is circa USD30. Moreover, according to the Dow, IBM which is currently priced at circa USD170, is still a much more important company than Apple whose share price is in the region of USD120 although IBM’s market cap of USD167 billion is a far cry than that of Apple at circa USD650 billion.
Although many critics claim that the Dow is a limited yardstick of the performance of the US stock market since it is a price-weighted gauge of just 30 blue-chip stocks, it is still an important overall indicator to the investing public and the index features prominently on international headlines on a daily basis.
One of the best known prophecies across US financial circles is the “Curse of the Dow” which refers to a popular belief that the companies that join the Dow Jones Industrial Average normally tend to underperform the ones they replace. Market observers claim that by the time a company is important enough to merit inclusion in this index, it has a tough time living up to expectations. Naturally this does not always apply. However, the last time that a change was made to the composition of the Dow on 19 March 2015, Apple replaced the multi-national telecoms conglomerate AT&T. Less than six weeks after being included in the Dow, the share price of Apple rallied to a new all-time high of USD134.54. However, the share price of Apple lost over 30% in the following twelve months, until it started to recover again and is currently trading at around the USD120 level.
Interesting too are the numerous milestones of the Dow since inception. It took just over 14 years for the Dow to double from a reading of 1,000 points in November 1972 to 2,000 points in January 1987, but only three years and four months to rally from 5,000 points in November 1995 to 10,000 points in March 1999. Thereafter, however, it took just under 18 years to double again from 10,000 to 20,000 points as the Dow suffered three major bear markets over the past 18 years.
After peaking at 11,750 points in mid-January 2000, the Dow and the other major US indices went through short periods of high volatility following the bursting of the dot-com bubble (the worst hit in this respect was the NASDAQ Composite index) and the 11 September 2001 terrorist attacks on the twin towers of the World Trade Center in New York.
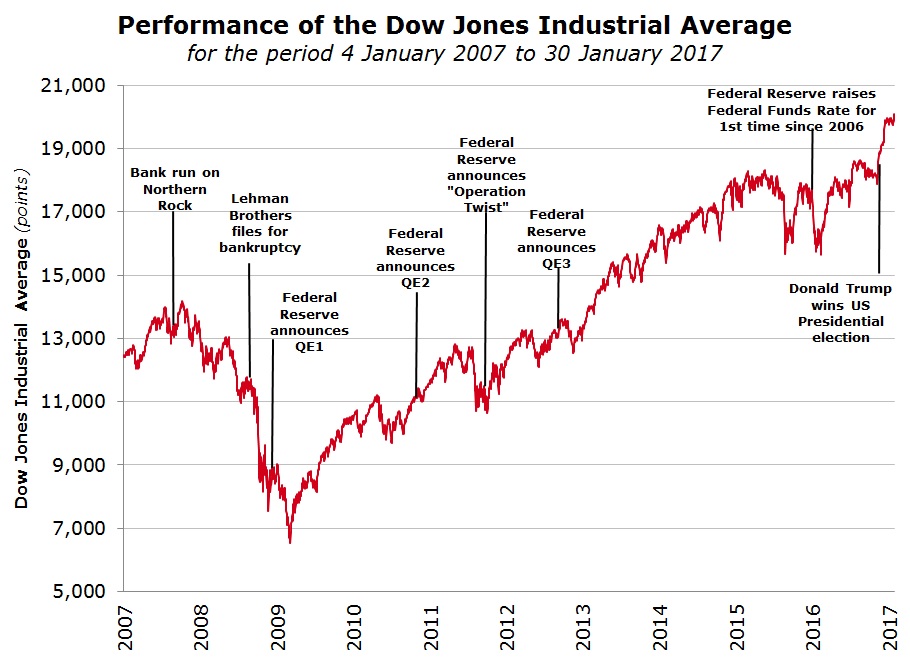
In fact, in a span of less than two years, the Dow hit a low of 7,197 points on 10 October 2002, representing a slump of nearly 40% from the January 2000 high. Subsequently, the 2002-2007 bull market followed, taking the Dow just past the 14,000 points level by 1 October 2007 only to fall back to 6,500 points in early March 2009 following the well-documented events leading up to the international financial crisis which culminated in the bankruptcy of Lehman Brothers on 15 September 2008.
Following the sharp rally since the lows of 2009, it took only 64 days for the Dow to reach 20,000 points after surpassing the 19,000 mark for the first time on 22 November 2016. So what was the major contributor to the rally over recent weeks?
The Dow climbed by 9.5% from 18,332.74 points on 8 November 2016 (US election day) to 20,068.51 points on 25 January 2017 – the day the index surpassed the 20,000 mark for the first time ever.
Equity markets rallied following Trump's unexpected win in November as investors speculated that a Trump administration would lead to higher infrastructure spending, looser financial regulations and also cuts in corporate taxes. Shares of banks and other cyclical companies climbed on hopes that a mix of tax cuts and fiscal stimulus from the Trump administration will accelerate economic growth and inflation and thus lead to higher rates of interest. Goldman Sachs has accounted for 379 points of the Dow’s 1,736-point march higher since US election day as its shares have climbed by 30.4%. Boeing, the aerospace group, has contributed 172 points as this equity gained 17.7% and the IT company IBM added 158 points to the Dow after its share price advanced by 14.9%. These companies exert the most influence on the performance of the Dow due to their respective elevated share prices in absolute terms.
Over the past three months, only five equities performed negatively, namely Wal-Mart (-4.2%); Johnson & Johnson (-3.6%); Coca-Cola (-1.8%); Cisco (-1.0%); and Procter & Gamble (-0.3%).
While the Dow increased by 9.5% between 8 November 2016 and 25 January 2017, other equity indices in the US trailed behind as the S&P 500 and the Nasdaq 100 only gained 7.4% and 7.2% respectively. Meanwhile, other indices across the world performed better. Germany’s DAX shot-up by 12.6%, Japan’s Nikkei 225 added 11.0% and the Euro Stoxx 50 advanced by 10.0%.
Although the Dow is normally given wide coverage across financial journals worldwide, due to the small number of constituents included in the index and the critical price-weighting of the index, the S&P 500, which is based on market capitalisation, is far more relevant to investors and analysts since it captures a much broader spectrum of corporate America.
Following last week’s eventful milestone for the Dow, many analysts are now eyeing the actual policies being enacted and implemented by the new US administration. Meanwhile, other financial observers continue to highlight that equity markets have increased significantly over the past 8 years – a time frame which is over twice the average duration of previous bull markets.
In fact, foreign research sources last week published some interesting statistics on the frequency of corrections in stock markets. Data compiled since 1932 indicates that the S&P 500 index suffers a 5% drop every 7 months; a 10% decline every 26 months and a 20% correction into bear market territory every 3.8 years (45 months). The last 20% correction took place during the financial crisis of 2008/9 and the main US indices have not suffered a 5% correction in almost a year. History is therefore suggesting that a market correction of at least 5% is now well overdue.
Print This Page DisclaimerThe article contains public information only and is published solely for informational purposes. It should not be construed as a solicitation or an offer to buy or sell any securities or related financial instruments. No representation or warranty, either expressed or implied, is provided in relation to the accuracy, completeness or reliability of the information contained herein, nor is it intended to be a complete statement or summary of the securities, markets or developments referred to in this article. Rizzo, Farrugia & Co. (Stockbrokers) Ltd (“Rizzo Farrugia”) is under no obligation to update or keep current the information contained herein. Since the buying and selling of securities by any person is dependent on that person’s financial situation and an assessment of the suitability and appropriateness of the proposed transaction, no person should act upon any recommendation in this article without first obtaining investment advice. Rizzo Farrugia, its directors, the author of this article, other employees or clients may have or have had interests in the securities referred to herein and may at any time make purchases and/or sales in them as principal or agent. Furthermore, Rizzo Farrugia may have or have had a relationship with or may provide or has provided other services of a corporate nature to companies herein mentioned. Stock markets are volatile and subject to fluctuations which cannot be reasonably foreseen. Past performance is not necessarily indicative of future results. Foreign currency rates of exchange may adversely affect the value, price or income of any security mentioned in this article. Neither Rizzo Farrugia, nor any of its directors or employees accepts any liability for any loss or damage arising out of the use of all or any part of this article. Additional information can be made available upon request from Rizzo, Farrugia & Co. (Stockbrokers) Ltd., Airways House, Fourth Floor, High Street, Sliema SLM 1551. Telephone: +356 2258 3000; Email: info@rizzofarrugia.com; Website: www.rizzofarrugia.com © 2021 Rizzo, Farrugia & Co. (Stockbrokers) Ltd. All rights reserved. This article may not be reproduced or redistributed, in whole or in part, without the written permission of Rizzo Farrugia. Moreover, Rizzo Farrugia accepts no liability whatsoever for the actions of third parties in this respect.
This article was produced by Edward Rizzo, Director at Rizzo Farrugia, which is a company licensed to undertake investment services in Malta by the MFSA under the Investment Services Act, Cap. 370 of the Laws of Malta and a member of the Malta Stock Exchange. The company’s registered address is at Airways House, Fourth Floor, High Street, Sliema SLM 1551, Malta.