
The Net Debt to EBITDA multiple
In one of my articles published several years ago, I had explained some of the more important financial metrics that investors needed to track on a regular basis.
One of the foremost ratios that I had mentioned was the level of gearing. I had also published a table showing the gearing level and the interest cover of a number of bond issuers on the Malta Stock Exchange. For bond issuers, the leverage or gearing ratio is one of the measures of a company’s level of creditworthiness showing the degree of financial leverage with a higher level of gearing equating to a higher level of risk.
It is fundamental for financial analysts and investors to keep track of a company’s financial performance and its metrics to measure any changes in the credit risk of the company. Naturally, the higher the credit risk, the higher the return that should be offered to an investor to compensate for the extra risk being undertaken. As such, it is important to measure whether the interest rate being offered is fair and provides adequate compensation to an investor for the risk being undertaken. This should be done both at the time of a new bond issue as well as during the lifetime of the bond since changes in the company’s financial metrics should be among the factors that dictate movements in the bond price of a particular issuer.
Bond prices should also be impacted by changes in the benchmark being used. As economic circumstances change, sovereign yields (which are normally the benchmark used for adequate pricing of corporate bonds) change from one day to the next. The obvious benchmark in Malta for the pricing of corporate bonds is the Malta Government Stock market. Investors who regularly follow movements across the bond market must have realised the strong upward movement in yields over recent months with a corresponding decline in prices. Since most new corporate bonds are of a 10-year maturity, the prevailing 10-year MGS at the time of issuance is used as a benchmark. By way of example, the yield on the 10-year MGS rallied from a low of 0.83% last October to between 1.4% and 1.5% early in 2017. Following the decline in MGS prices and the corresponding increase in yields of circa 55 to 70 basis points, this should impact both the secondary market prices of corporate bonds with a maturity of 2026 and also the pricing of new bonds coming to the market this year.
The measurement of gearing is also important for equity issuers. Financial analysts and investors should keep a close look at the gearing of an equity issuer since this can have a material impact on the company’s cash flows. The gearing level will also indirectly indicate the ability of a company to distribute or maintain a certain level of dividends to shareholders as well as a company’s ability to fund future growth plans.
In the past, the standard form of measuring gearing across the local market was a comparison of a company’s level of net debt as a proportion of the equity base or the total funding mix (equity and debt). This is a good measure for analysts to gauge the extent of the company’s leverage.
However, the more commonly used measure internationally is the net debt to EBITDA. This is one of the key financial ratios used by credit rating agencies to assess the creditworthiness of a company. This ratio is also very frequently included in loan agreements as a covenant saying that the company must remain above a certain debt to EBITDA ratio. If it breaches this pre-determined level, it would need to pay back the bank loan.
Earnings before interest, tax, depreciation and amortisation (EBITDA) is a very common measure of a company’s operational profitability and nowadays it is also being used very often across local financial circles. The ‘net debt to EBITDA’ measurement of leverage is calculated by dividing a company’s interest-bearing borrowings net of any cash or cash equivalents by its EBITDA. The net debt to EBITDA ratio is essentially a debt ratio that shows how many years it would take for a company to pay back its debt if net debt and EBITDA are held constant.
Most research reports published by investment banks always make reference to the net debt to EBITDA multiple. Last week, in an article published in the Financial Times about the turnaround strategy of Carlsberg, reference was made to the brewer’s ability in generating higher levels of profitability and the author highlighted the fact that the turnaround is beginning to work since the company’s net debt has fallen from 2.3 times EBITDA to just under 2 times. In essence, this means that in 2 years the company can repay all its borrowings from the operating profit being generated assuming the financial performance remains unchanged.
Across the MSE, one can distinguish between two types of bond issuers. Several companies in Malta have a large asset base mainly composed of property assets such as hotel owners and companies with other property and commercial developments. On the other hand, the less capital-intensive companies are not very property rich and naturally have a lower level of shareholders’ funds to support their smaller asset base.
Given such distinguishing features of some of the bond issuers in Malta, I feel it is therefore important for analysts and investors to also measure the net debt to EBITDA multiple apart from the conventional measure which we are used to seeing across Financial Analysis Summaries and other publications of local bond issuers. It is equally important for both measures to be calculated for an investor to understand the rationale behind the different interpretations of such ratios based on the business dynamics of the company in question.
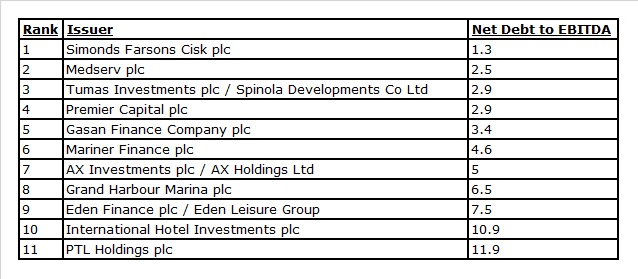
In this table, I am publishing a selected number of the net debt to EBITDA multiples across some of the local bond issuers. Unfortunately, these figures are mainly based on the 2015 annual financial statements since the annual reporting season is only about to commence. I will endeavour to repeat this exercise in the coming months once all bond issuers publish their 2016 annual financial statements.
The only company that has so far published its 2016 financial statements is AX Holdings Ltd since their year-end is 31 October. AX Holdings Ltd is the guarantor of the bonds issued by AX Investments plc and it is therefore correct to analyse the performance of the Group holding company as guarantor rather than that of the finance vehicle. During the 2015/16 financial year, the AX Group generated EBITDA of €12.7 million. Meanwhile, as at 31 October 2016, the net level of borrowings amounted to €63.6 million. As such, the net debt to EBITDA multiple is of 5 times. Shareholders’ funds of the AX Group increased to €163.7 million by 31 October 2016 following the profit generated during the year as well as the net property revaluation of €48.2 million. As such, the standard measure of gearing indicated a ratio of 28% (net debt divided by the sum of net debt and equity) or 0.4 times (the ratio of net debt to equity).
In the case of AX Holdings Ltd, these two measures depict a picture where the level of gearing seems on the ‘low’ side when viewed from the perspective of the overall level of equity within the business. However, the net debt to EBITDA measure of 5 times is regarded as being elevated. Although the operating profits generated from the hotel portfolio have improved remarkably over recent years in line with the extraordinary growth in tourism, one reason for this elevated ratio may be due to the fact that the AX Group took on added borrowings in 2014 to fund the development of the Hilltop Gardens which is still in the early stages of its life cycle and is therefore not yet generating a meaningful level of EBITDA. One would therefore expect the net debt to EBITDA multiple to improve in the years ahead as the Group’s EBITDA increases further.
Given the importance of both gearing measures depending on the characteristics of the issuer, financial analysts and authors of a Financial Analysis Summary should ensure that both methods are published to enable investors to have sufficient information to gauge the level of credit risk. The investing community needs to become more sophisticated and have available a variety of ratios to understand the level of creditworthiness of companies especially in view of the likely strong pipeline of new issuers approaching the bond market this year.
Print This Page DisclaimerThe article contains public information only and is published solely for informational purposes. It should not be construed as a solicitation or an offer to buy or sell any securities or related financial instruments. No representation or warranty, either expressed or implied, is provided in relation to the accuracy, completeness or reliability of the information contained herein, nor is it intended to be a complete statement or summary of the securities, markets or developments referred to in this article. Rizzo, Farrugia & Co. (Stockbrokers) Ltd (“Rizzo Farrugia”) is under no obligation to update or keep current the information contained herein. Since the buying and selling of securities by any person is dependent on that person’s financial situation and an assessment of the suitability and appropriateness of the proposed transaction, no person should act upon any recommendation in this article without first obtaining investment advice. Rizzo Farrugia, its directors, the author of this article, other employees or clients may have or have had interests in the securities referred to herein and may at any time make purchases and/or sales in them as principal or agent. Furthermore, Rizzo Farrugia may have or have had a relationship with or may provide or has provided other services of a corporate nature to companies herein mentioned. Stock markets are volatile and subject to fluctuations which cannot be reasonably foreseen. Past performance is not necessarily indicative of future results. Foreign currency rates of exchange may adversely affect the value, price or income of any security mentioned in this article. Neither Rizzo Farrugia, nor any of its directors or employees accepts any liability for any loss or damage arising out of the use of all or any part of this article. Additional information can be made available upon request from Rizzo, Farrugia & Co. (Stockbrokers) Ltd., Airways House, Fourth Floor, High Street, Sliema SLM 1551. Telephone: +356 2258 3000; Email: info@rizzofarrugia.com; Website: www.rizzofarrugia.com © 2021 Rizzo, Farrugia & Co. (Stockbrokers) Ltd. All rights reserved. This article may not be reproduced or redistributed, in whole or in part, without the written permission of Rizzo Farrugia. Moreover, Rizzo Farrugia accepts no liability whatsoever for the actions of third parties in this respect.
This article was produced by Edward Rizzo, Director at Rizzo Farrugia, which is a company licensed to undertake investment services in Malta by the MFSA under the Investment Services Act, Cap. 370 of the Laws of Malta and a member of the Malta Stock Exchange. The company’s registered address is at Airways House, Fourth Floor, High Street, Sliema SLM 1551, Malta.