
An overview of the FTSE 100
Maltese investors who have been investing internationally over the years may have gained exposure at some point in time to a number of the companies forming part of the FTSE 100. Today’s article aims at providing an overview of the UK’s main benchmark index and its current composition due to the changes over the years as a result of various corporate actions such as mergers and acquisitions.
The FTSE 100 index comprises the 100 largest companies listed on the London Stock Exchange (LSE). It provides a snapshot of the most highly capitalised ‘blue-chip’ companies in the UK trading on the main market in London.
The name ‘FTSE’ originates from when it was jointly owned by the Financial Times and the London Stock Exchange. In May 2015, the FTSE Group combined with Russell Investments to form the brand name FTSE Russell. The group produces, maintains and licenses stock market indices enabling investors, portfolio managers and financial journalists to measure sections of the overall stock market. Apart from the most popular FTSE 100, the group also produces several other equity indices such as the FTSE 250, the FTSE MIB, the FTSE AIM 100 Index and the Russell 2000 Index. Moreover, the FTSE Russell group maintains bond indices, property indices as well as sustainable investment indices designed to meet the environmental, social, and governance (ESG) requirements of investors.
The FTSE 100 is London’s flagship stock index and as such it is one of the indices tracked by most business commentators together with the S&P 500 in the US, the Dow Jones Industrial Average, the Nasdaq 100 composite, Germany’s DAX and other mainstream indices tracking other large stockmarkets such as China, Japan, etc.
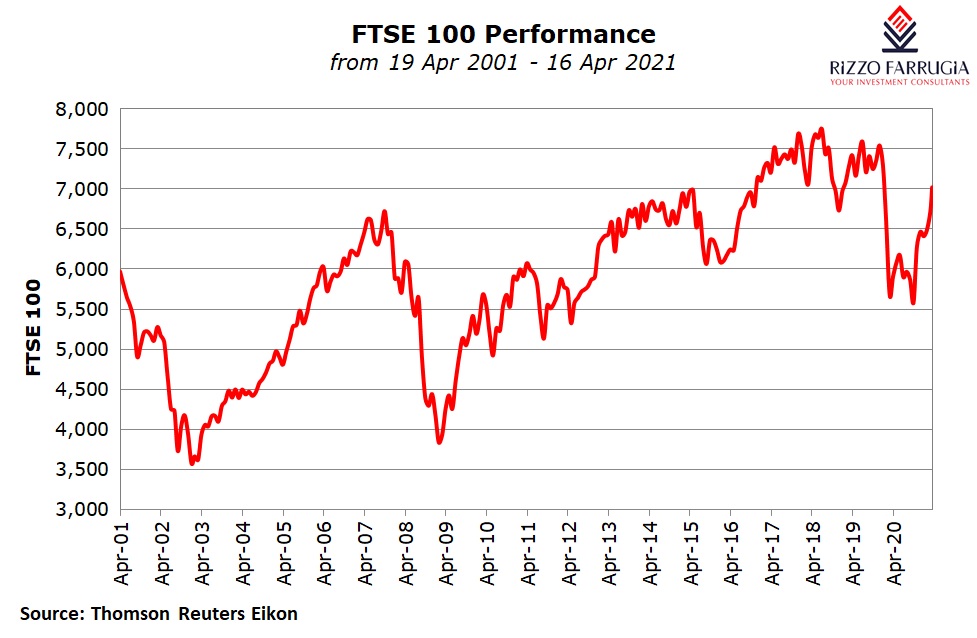
The FTSE 100, which is a market-cap weighted index, was created in January 1984 with a starting level of 1,000 points. Last week, the index surpassed the 7,000 mark once again (its highest level since October 2019). This is the first time that the index managed to exceed this psychological milestone since the start of the COVID-19 pandemic in early 2020 which had led to a sharp decline in equity markets across the world including in the UK. The FTSE 100 had dropped by 35% into bear market territory between mid-January 2020 and 23 March 2020 at the start of the COVID-19 pandemic.
However, it is worth highlighting that the sharpest fall in percentage terms in a single day was on 20 October 1987, the day after “Black Monday”, when the FTSE 100 fell by 12.22%.
Meanwhile, the FTSE 100 hit an all-time high of 7,903.5 points on 22 May 2018 and closed that day at 7,877.45 points.
Although the FTSE 100 is often considered a leading indicator of the UK economy and is the main benchmark followed by international investors to gain exposure to UK companies, several companies forming part of the index are multi-national and mainly dependent on economies other than the UK. Some of these companies include the energy companies BP plc and Royal Dutch Shell plc, as well as HSBC Holdings plc that derives most of its profits from its Asian business.
The composition of the Footsie, as it is sometimes referred to, is revisited every quarter to ensure that it still reflects the top 100 companies by market capitalisation.
As at 31 March 2021, the top 5 companies (namely Unilever plc, AstraZeneca plc, HSBC Holdings plc, Diageo plc and GlaxoSmithKline plc) accounted for just over 23% of the overall market capitalisation of the FTSE 100.
When analysing the composition of the index it transpires that there are four sectors – namely financials, basic materials, consumer goods, and oil and gas – that account for close to 70% of the market cap of all the companies.
Financial companies incorporating banks, insurance companies and other companies operating within the broader financial sector account for the largest sector within the FTSE 100. The largest constituent is HSBC Holdings plc followed by Prudential plc, Barclays plc, Lloyds Banking Group plc and London Stock Exchange Group plc.
The consumer goods sector accounts for almost 17% of the index and is represented by Unilever plc, Diageo plc, British American Tobacco plc, Reckitt Benckiser Group plc among several others.
Another influential sector within the FTSE 100 index is basic materials with a weighting of over 16%. The two largest companies within this sector are Rio Tinto plc and BHP Group plc. In view of the high weighting of resource companies within the index, commodity price movements have a material impact on the overall direction of the FTSE 100.
The oil and gas sector is another dominant one within the FTSE 100 represented by Royal Dutch Shell plc and BP plc.
In view of the various companies operating within energy and mining industries there is a close correlation with the fortunes of fast-growing developing economies like China which consume a large proportion of the world’s natural resources.
From the above analysis, one would realise the very low exposure of the FTSE 100 to technology companies at just over 1% of the overall market capitalisation. In contrast, the S&P 500 in the US has over 30% exposure to technology companies (when including Alphabet and Facebook which are classified under ‘Communication Services’) given the spectacular rise in share prices over recent years of companies such as Apple and Microsoft which are also the two largest companies in the world .
Since a large proportion of the profits generated by several companies forming part of the FTSE 100 index are derived from outside the UK, fluctuations in the value of the British pound are an important determinant of overall movements across the FTSE 100. As such, a weak sterling generally leads to a high value for the index as profits derived in other major currencies such as the USD are worth more when translated back into sterling. This was evident following the plunge in the value of the pound in the wake of the Brexit vote in June 2016. Conversely, a rising pound means companies doing business in Europe would earn less in the UK.
In fact, the FTSE 100 rallied by 14.4% in 2016 and outperformed the other major equity indices as the British pound declined materially following the vote on Brexit. However, since then, the FTSE 100 underperformed in most years with the index suffering double-digit losses in 2018 (-12.5%) and 2020 (-14.3%). The FTSE 100 has so far gained over 8% in 2021 despite the strengthening of Sterling which, as explained above, generally has a negative impact on the performance of the index.
In view of the multi-national dimension of several of the companies forming part of the FTSE 100, a better indicator of the UK economy is the FTSE 250 since the proportion of international companies on that index is much smaller.
There are many ways that local and international investors can gain exposure to the FTSE 100 in order to diversify their investment portfolios. The most cost-effective way is via an Exchange Traded Fund that replicates the composition of the index. One of the most common FTSE 100 ETF’s is the iShares FTSE 100 with a total of GBP9.6 billion in assets. The top holdings within this ETF are Unilever plc, AstraZeneca plc, HSBC Holdings plc, Diageo plc and GlaxoSmithKline plc which mirror the largest companies within the FTSE 100 index.
While in the past many investors would select a handful of shares to gain exposure to a particular stockmarket or a sector that is deemed to be favourable, nowadays ‘passive investing’ via ETF’s has grown in popularity given the wide array of such securities available and the ease at which one can gain a good element of diversification across an investment portfolio.
Print This Page DisclaimerThe article contains public information only and is published solely for informational purposes. It should not be construed as a solicitation or an offer to buy or sell any securities or related financial instruments. No representation or warranty, either expressed or implied, is provided in relation to the accuracy, completeness or reliability of the information contained herein, nor is it intended to be a complete statement or summary of the securities, markets or developments referred to in this article. Rizzo, Farrugia & Co. (Stockbrokers) Ltd (“Rizzo Farrugia”) is under no obligation to update or keep current the information contained herein. Since the buying and selling of securities by any person is dependent on that person’s financial situation and an assessment of the suitability and appropriateness of the proposed transaction, no person should act upon any recommendation in this article without first obtaining investment advice. Rizzo Farrugia, its directors, the author of this article, other employees or clients may have or have had interests in the securities referred to herein and may at any time make purchases and/or sales in them as principal or agent. Furthermore, Rizzo Farrugia may have or have had a relationship with or may provide or has provided other services of a corporate nature to companies herein mentioned. Stock markets are volatile and subject to fluctuations which cannot be reasonably foreseen. Past performance is not necessarily indicative of future results. Foreign currency rates of exchange may adversely affect the value, price or income of any security mentioned in this article. Neither Rizzo Farrugia, nor any of its directors or employees accepts any liability for any loss or damage arising out of the use of all or any part of this article. Additional information can be made available upon request from Rizzo, Farrugia & Co. (Stockbrokers) Ltd., Airways House, Fourth Floor, High Street, Sliema SLM 1551. Telephone: +356 2258 3000; Email: info@rizzofarrugia.com; Website: www.rizzofarrugia.com © 2021 Rizzo, Farrugia & Co. (Stockbrokers) Ltd. All rights reserved. This article may not be reproduced or redistributed, in whole or in part, without the written permission of Rizzo Farrugia. Moreover, Rizzo Farrugia accepts no liability whatsoever for the actions of third parties in this respect.
This article was produced by Edward Rizzo, Director at Rizzo Farrugia, which is a company licensed to undertake investment services in Malta by the MFSA under the Investment Services Act, Cap. 370 of the Laws of Malta and a member of the Malta Stock Exchange. The company’s registered address is at Airways House, Fourth Floor, High Street, Sliema SLM 1551, Malta.