
Dow Jones index reaches 30,000 points
November has been an extraordinary month for international equity markets. Although the number of COVID-19 cases across most parts of the world are increasing at a very fast pace and further lockdowns and restrictions are being imposed, the major equity indices registered their best monthly performances in several years.
As I explained in last week’s article, uncertainty has abated following both the outcome of the US Presidential election (as a Biden-led administration is widely seen as favourable to the principles underpinning globalisation and international cooperation) and the positive results from a number of vaccine candidates that are likely to obtain regulatory approval from the US Food and Drug Administration within the next 10 days. These developments led to a significant rally in equity markets as investors are anticipating an upcoming period of supportive world order coupled with a return to normality once an effective roll-out of vaccines takes place. In the US, for instance, the S&P 500 index climbed by 10.8% during the month of November while the Dow Jones Industrial Average (“DJIA”) index gained 11.8%. Meanwhile, the Stoxx Europe 600 Index rallied by 13.7% during November and the FTSE 100 in the UK climbed 12.4% as its performance has been boosted by the considerable exposure to the oil and gas sector which was among the best performing sectors last month following the notable underperformance in previous months.
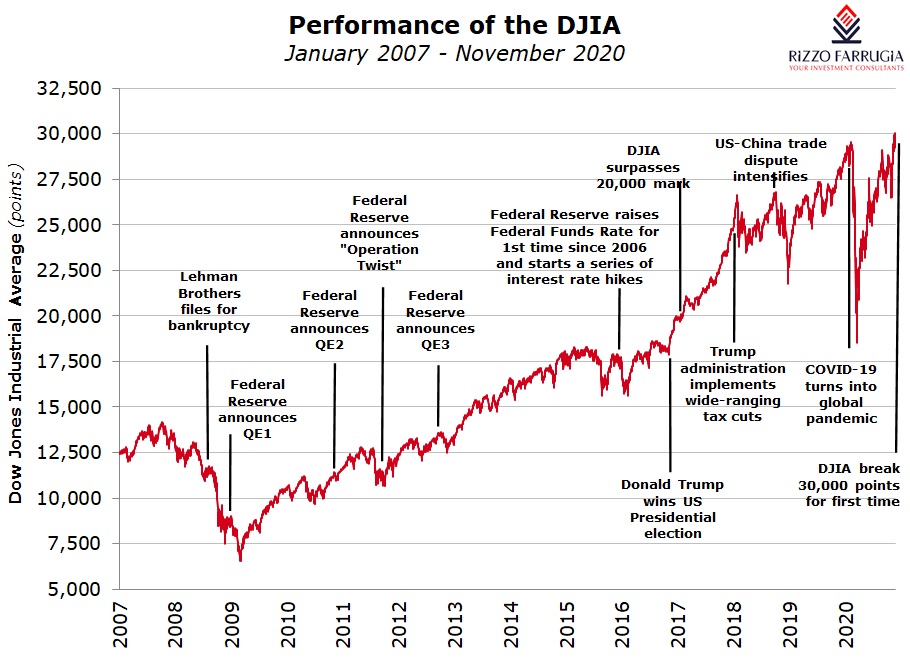
In the midst of this extraordinary rally across equity markets, another important milestone was established by the DJIA index in the US as it surpassed the 30,000-point level on 24 November for the first time ever.
The DJIA had touched the 20,000-point level in early 2017, thus translating in a rally of 50% in just under 4 years. This contrasts sharply with the previous milestones recorded by the DJIA as it had taken almost 18 years for the index to double from 10,000 points in March 1999 to 20,000 points in January 2017 in view of the sharp pullbacks registered during the ‘dot-com’ crash and the international financial crisis.
Although the DJIA rallied by over 50% in under 4 years to surpass the 30,000-point level last week, it is worth noting that the index had rallied by 25% in just less than a year as it had reached the 25,000 mark on 4 January 2018. The equity market had a bumpy ride since then with the DJIA dropping 5.6% in 2018 (the worst year in a decade) but bounced back in 2019 with a rise of 22.3% to 28,538 points.
The DJIA suffered its quickest (and shortest) move into bear market territory earlier this year as it shed 38% between 12 February and 23 March. However, since its low of 18,213 points recorded on 23 March, the index jumped by an extraordinary 65% in eight months mainly arising from the stellar performances of some of its largest constituents following the significant support from governments and central banks which boosted investor confidence.
It is worth highlighting that the DJIA index is a price-weighted index. This means that the companies with the highest absolute share prices have a larger influence on the performance of the index. Accordingly, following the 4-for-1 share split by Apple in August, the weighting of Apple in the DJIA index dropped from 12% to around 3%. This resulted in Apple dropping to the 17th largest company in the index compared to the largest weighting prior to the share split. On the other hand, the S&P 500 index is weighted according to the market capitalisation of the individual constituents. In fact, since Apple is the largest company in terms of market cap (currently at just below USD2 trillion), it is the single largest component of the S&P 500 with a weighting of just over 6%.
The S&P 500 is seen by many as a better index since it contains many more companies compared to the DJIA and its weighting by market capitalisation provides a better representation of the market and economic sectors. In fact, the companies forming the S&P have a market cap of USD32 trillion compared to the value of USD9.2 trillion for the DJIA.
A number of other changes to the composition of the 30 companies forming the DJIA index took place on 31 August coinciding with the share split by Apple. The longest-serving company forming part of the DJIA, the US oil giant Exxon Mobil, was replaced by the cloud computing company Salesforce. Likewise, the pharmaceutical company Pfizer and the aerospace and defence manufacturer Raytheon Technologies were removed. These were replaced by Amgen (a biotechnology firm) and the aerospace and industrial manufacturer Honeywell International which is being reinstated after it had been removed in February 2008.
As a result of the Apple share split and the changes in the composition of the DJIA, UnitedHealth Group became the most heavily-weighted component, followed by Home Depot (the largest home improvement retailer in the US) and the newcomer Salesforce. Although Apple has a market cap of just under USD2 trillion, it now ranks in the 22nd position with a weighting of only 2.6%.
The decline in the weighting of Apple in August dropped the allocation to the technology sector in the DJIA from about 28% to 20%. However, the addition of Salesforce also in August brought the technology weighting back up to about 23% compared to just over 18% in 2010. Likewise, the ‘consumer discretionary’, ‘health care’, ‘industrials’ and ‘financials’ sectors have double-digit weightings in the DJIA, whereas ‘energy’ and ‘materials’ have a relatively insignificant combined influence of around 3%.
Similarly, these two sectors now account for a small portion of the S&P 500 whilst ‘technology’, ‘health care’, ‘consumer discretionary’ and ‘communication services’ represent the lion’s share of the S&P 500 index. In this respect, however, it is important to recall the significant influence that Amazon has within the ‘consumer discretionary’ sector, and that of Alphabet (the parent company of Google) and Facebook within ‘communication services’. As such, the recent reclassification of these companies into ‘consumer discretionary’ and ‘communication services’ underestimates the true weighting that technology today plays in the performance of the S&P 500.
The top 5 companies forming part of the DJIA – namely UnitedHealth Group, Home Depot, Salesforce, Goldman Sachs and Amgen – account for nearly 30% of the index. On the other hand, the top 5 companies of the S&P 500 are Apple, Microsoft, Amazon, Alphabet and Facebook constituting over 20% of the S&P 500 with Apple being the single largest component at 6.2%. These same five stocks account for 50% of the NASDAQ 100 index but represent a smaller portion of the NASDAQ Composite as the latter includes over 2,500 companies.
The recent changes to the DJIA greatly diminished Apple’s influence on the index which has the largest market cap across the US market. This means that in the future there may be a wider divergence of the performance of the DJIA compared to the S&P 500 and the NASDAQ. This has already been evident this year with the DJIA now up only 3.9% in 2020, compared to 12.1% for the S&P 500 and 36% for the Nasdaq. On the other hand, if cyclical stocks outperform the technology sector in 2021 as some investment banks forecast, the DJIA could outperform both the S&P500 and the NASDAQ.
Looking ahead, market sentiment and the performance of international equity markets will be driven by various factors, namely: (i) further developments with respect to COVID-19 vaccines with two of the frontrunners likely to be approved by the US Food and Drug Administration in the coming days; (ii) further restrictions to curb the flow of the virus in various parts across the world; (iii) additional monetary stimulus by the ECB expected during next week’s final monetary policy meeting of 2020; (iv) any progress that may be registered on a further US stimulus package; and (v) the restoration of trade relations of the US with other major economies like China and the EU. 2020 has been nothing short of an extraordinary year for equity markets and 2021 is also expected to have its fair share of challenges as the world exits the pandemic. However, a renowned market commentator in the US last week argued that given that interest rates are at record low levels around the world, equities represent the best asset class for investing for the coming years. This same commentator predicted that it could take another 4 to 5 years for the DJIA to hit the 40,000-point level. If this were to be achieved, it would represent a compound annual gain of between 6% to 7.5% which would indeed be a remarkable return given the ‘low for longer’ interest rate scenario across all main currencies.
Print This Page DisclaimerThe article contains public information only and is published solely for informational purposes. It should not be construed as a solicitation or an offer to buy or sell any securities or related financial instruments. No representation or warranty, either expressed or implied, is provided in relation to the accuracy, completeness or reliability of the information contained herein, nor is it intended to be a complete statement or summary of the securities, markets or developments referred to in this article. Rizzo, Farrugia & Co. (Stockbrokers) Ltd (“Rizzo Farrugia”) is under no obligation to update or keep current the information contained herein. Since the buying and selling of securities by any person is dependent on that person’s financial situation and an assessment of the suitability and appropriateness of the proposed transaction, no person should act upon any recommendation in this article without first obtaining investment advice. Rizzo Farrugia, its directors, the author of this article, other employees or clients may have or have had interests in the securities referred to herein and may at any time make purchases and/or sales in them as principal or agent. Furthermore, Rizzo Farrugia may have or have had a relationship with or may provide or has provided other services of a corporate nature to companies herein mentioned. Stock markets are volatile and subject to fluctuations which cannot be reasonably foreseen. Past performance is not necessarily indicative of future results. Foreign currency rates of exchange may adversely affect the value, price or income of any security mentioned in this article. Neither Rizzo Farrugia, nor any of its directors or employees accepts any liability for any loss or damage arising out of the use of all or any part of this article. Additional information can be made available upon request from Rizzo, Farrugia & Co. (Stockbrokers) Ltd., Airways House, Fourth Floor, High Street, Sliema SLM 1551. Telephone: +356 2258 3000; Email: info@rizzofarrugia.com; Website: www.rizzofarrugia.com © 2021 Rizzo, Farrugia & Co. (Stockbrokers) Ltd. All rights reserved. This article may not be reproduced or redistributed, in whole or in part, without the written permission of Rizzo Farrugia. Moreover, Rizzo Farrugia accepts no liability whatsoever for the actions of third parties in this respect.
This article was produced by Edward Rizzo, Director at Rizzo Farrugia, which is a company licensed to undertake investment services in Malta by the MFSA under the Investment Services Act, Cap. 370 of the Laws of Malta and a member of the Malta Stock Exchange. The company’s registered address is at Airways House, Fourth Floor, High Street, Sliema SLM 1551, Malta.