
A comparison of the net debt to EBITDA across bond issuers
Over the past two weeks I published the return on equity league table and the dividend league table. The ROE and dividend yields are very important financial metrics for equity investors.
From a bond perspective, other financial indicators are important to track at least on an annual basis once the various issuers publish their financial statements. Several years ago I had explained that bond investors need to understand the concept of the interest cover (the amount of times that a company’s operating profits cover net finance costs) as well as the debt to equity ratio which measures the level of leverage or gearing of a company.
Moreover, earlier this year, I also portrayed another interpretation of the gearing ratio, i.e. the net debt to EBITDA multiple which is a more common metric used across international financial markets and appears very often in press releases and announcements by many multinationals.
Many local investors should by now be used to the term ‘Earnings before interest, tax, depreciation and amortisation’ (EBITDA) which has become a widely used measure of a company’s operational profitability. The ‘net debt to EBITDA’ is calculated by dividing a company’s interest-bearing borrowings net of any cash or cash equivalents by its EBITDA. The net debt to EBITDA ratio is essentially a debt ratio that shows how many years it would take for a company to pay back its debt if net debt and EBITDA are assumed to remain constant.
When I had introduced this term to many local investors in February 2017 I had also published a ranking of some of the bond issuers using the figures from their 2015 financial statements. In the article I had stated that once the 2016 financial statements are published, an updated table will be issued showing the ranking of a number of bonds listed on the Malta Stock Exchange.
Due to space restrictions, I cannot comment on each of the companies whose bonds are listed on the MSE. Instead, I will explain some of the more important observations that emerge from the classification.
The top ranking in the net debt to EBITDA table goes once again to Simonds Farsons Cisk plc. Farsons recently published its January 2017 annual results. However, the company has so far only issued a condensed balance sheet and cash flow statement (the full annual report will be published in the coming days ahead of the Annual General Meeting on 27 June 2017) and this makes it hard to calculate an exact figure of net debt. However, from an estimate based on the condensed financial statements, it is evident that the overall borrowings of the group increased due to the investment in the new beer packaging facility. Meanwhile, from an operational perspective, the group had another very successful year as EBITDA climbed by a further 12.4% to yet another record of €21 million. As such, the net debt to EBITDA multiple is of around 1.7 times. Although this implies a slight deterioration from the 2015 figure of 1.3 times, it still represents a very strong ratio. Essentially, it means that the Farsons group can repay its borrowings in under 2 years.
Premier Capital plc ranks in second place as its net debt to EBITDA multiple improved substantially between 2015 and 2016 from 2.9 times to 1.8 times following the successful acquisition in Romania which boosted the company’s performance. In fact, Premier Capital registered an EBITDA of €32.7 million in 2016. During a meeting held with the management of the company last week, it was disclosed that the EBITDA is anticipated to edge up to €35 million during 2017. A deeper analysis on the estimated net debt to EBITDA multiple can be undertaken once the company shortly publishes its Financial Analysis Summary.
Tumas Investments plc saw its net debt to EBITDA multiple weaken marginally between 2015 and 2016 from 2.9 times to 3.1 times. This is based on the financial statements of the guarantor, Spinola Development Company Limited. Total EBITDA reached €15.2 million which represents a decrease of 6.7% from the previous year on account of the temporary closure of the hotel for refurbishing between February and April 2016 as well as a decline in property sales due to the lower stock of apartments available for sale. The company will also be publishing its Financial Analysis Summary shortly and the EBITDA during 2017 is bound to improve due to a full 12-month contribution from the hotel and the possibility of the recognition of some of the apartment sales within the Laguna complex as these should start being handed over to their owners by the end of 2017.
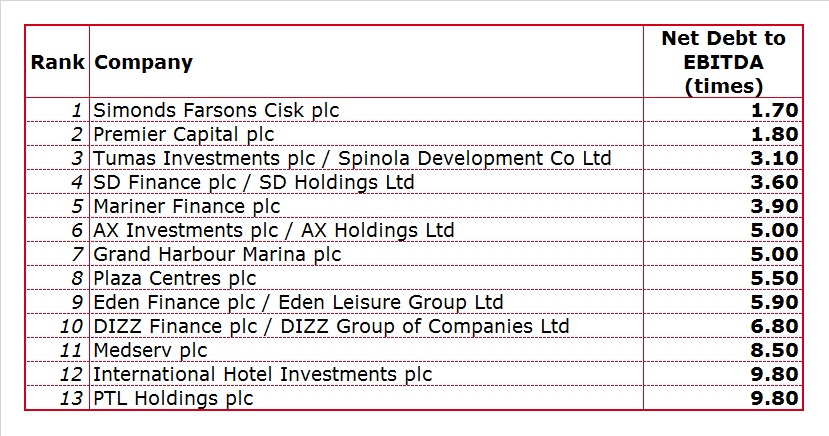
The new entrant SD Finance plc places fourth in the net debt to EBITDA ranking with a figure of 3.6 times based on the 31 March 2016 financial statements of the guarantor SD Holdings Ltd. The Prospectus published at the time of the bond issue earlier this year also included the forecasts for the 12-month period to 31 March 2017 which showed that the net debt to EBITDA multiple should improve to 3.2 times. These can be verified once the company publishes its financial statements in the months ahead.
The company which lost most positions in the net debt to EBITDA ranking was Medserv plc. From second position in 2015 with a net debt to EBITDA multiple of 2.5 times, it moved down to eleventh place as the net debt to EBITDA climbed to 8.5 times. In the early part of 2016, Medserv increased its borrowings to partly fund the acquisition of the METS group of companies in the Middle East. However, the deterioration in the net debt to EBITDA was mostly due to the decline in EBITDA to €5.5 million as a result of the challenging conditions across the oil and gas industry as well as the delay in a number of projects.
International Hotel Investments plc improved its net debt to EBITDA from 10.9 times in 2015 to 9.8 times following the continued improvement in operating performance of many of the group’s hotels. It is worth highlighting however that the EBITDA taken in this calculation excludes the two most important properties within the group (the Corinthia Hotel London and the Golden Sands Resort in Malta) since they are 50% owned by IHI. Since these two properties are not consolidated in the financial statements, the debt within these hotels are also excluded from the overall net debt figure of €370 million. At a recent meeting with financial analysts, IHI’s Chairman Mr Alfred Pisani announced that, following discussions with the company’s auditors, the financials of the London property will start being consolidated in the financial statements as from 2017 in view of the ownership structure of the company owning the London property, namely NLI Holdings.
A number of companies whose bonds are listed on the Official List of the MSE are property development companies. Due to the fact that the financial performance of such companies which include MIDI plc, Pendergardens Developments plc and GAP Group plc are highly influenced by the timing of property sales, it is difficult to compare the net debt to EBITDA multiple in a single year with those of other companies which generate regular levels of income. The more important aspect behind these companies are the properties secured in favour of bondholders and the success of entering into promise of sales agreements and subsequent contracts of sale.
Meanwhile, three other companies registered a negative EBITDA during 2016, namely Mediterranean Investments Holding plc, Hal Mann Vella Group plc and Mediterranean Maritime Hub Finance plc. In view of the weak financial performances of these companies, investors need to attentively review the respective Financial Analysis Summary being published in the coming weeks to check the company’s financial projections and verify whether these are reasonable and achievable. Investors would also need to check whether these companies can indeed return to operational profitability in the near-term.
Financial analysts and investors need to keep track of a company’s financial performance and its debt metrics to measure any changes in the credit risk of the company. Naturally, the higher the credit risk, the higher the return that should be offered to an investor to compensate for the extra risk being undertaken. Although this is highly subjective, it is important to consider whether the interest rate being offered is fair and provides adequate compensation to an investor for the risk being undertaken. This should be done both at the time of a new bond issue as well as during the lifetime of the bond since changes in the company’s financial metrics should be among the factors that dictate movements in the bond price of a particular issuer.
Print This Page DisclaimerThe article contains public information only and is published solely for informational purposes. It should not be construed as a solicitation or an offer to buy or sell any securities or related financial instruments. No representation or warranty, either expressed or implied, is provided in relation to the accuracy, completeness or reliability of the information contained herein, nor is it intended to be a complete statement or summary of the securities, markets or developments referred to in this article. Rizzo, Farrugia & Co. (Stockbrokers) Ltd (“Rizzo Farrugia”) is under no obligation to update or keep current the information contained herein. Since the buying and selling of securities by any person is dependent on that person’s financial situation and an assessment of the suitability and appropriateness of the proposed transaction, no person should act upon any recommendation in this article without first obtaining investment advice. Rizzo Farrugia, its directors, the author of this article, other employees or clients may have or have had interests in the securities referred to herein and may at any time make purchases and/or sales in them as principal or agent. Furthermore, Rizzo Farrugia may have or have had a relationship with or may provide or has provided other services of a corporate nature to companies herein mentioned. Stock markets are volatile and subject to fluctuations which cannot be reasonably foreseen. Past performance is not necessarily indicative of future results. Foreign currency rates of exchange may adversely affect the value, price or income of any security mentioned in this article. Neither Rizzo Farrugia, nor any of its directors or employees accepts any liability for any loss or damage arising out of the use of all or any part of this article. Additional information can be made available upon request from Rizzo, Farrugia & Co. (Stockbrokers) Ltd., Airways House, Fourth Floor, High Street, Sliema SLM 1551. Telephone: +356 2258 3000; Email: info@rizzofarrugia.com; Website: www.rizzofarrugia.com © 2021 Rizzo, Farrugia & Co. (Stockbrokers) Ltd. All rights reserved. This article may not be reproduced or redistributed, in whole or in part, without the written permission of Rizzo Farrugia. Moreover, Rizzo Farrugia accepts no liability whatsoever for the actions of third parties in this respect.
This article was produced by Edward Rizzo, Director at Rizzo Farrugia, which is a company licensed to undertake investment services in Malta by the MFSA under the Investment Services Act, Cap. 370 of the Laws of Malta and a member of the Malta Stock Exchange. The company’s registered address is at Airways House, Fourth Floor, High Street, Sliema SLM 1551, Malta.